
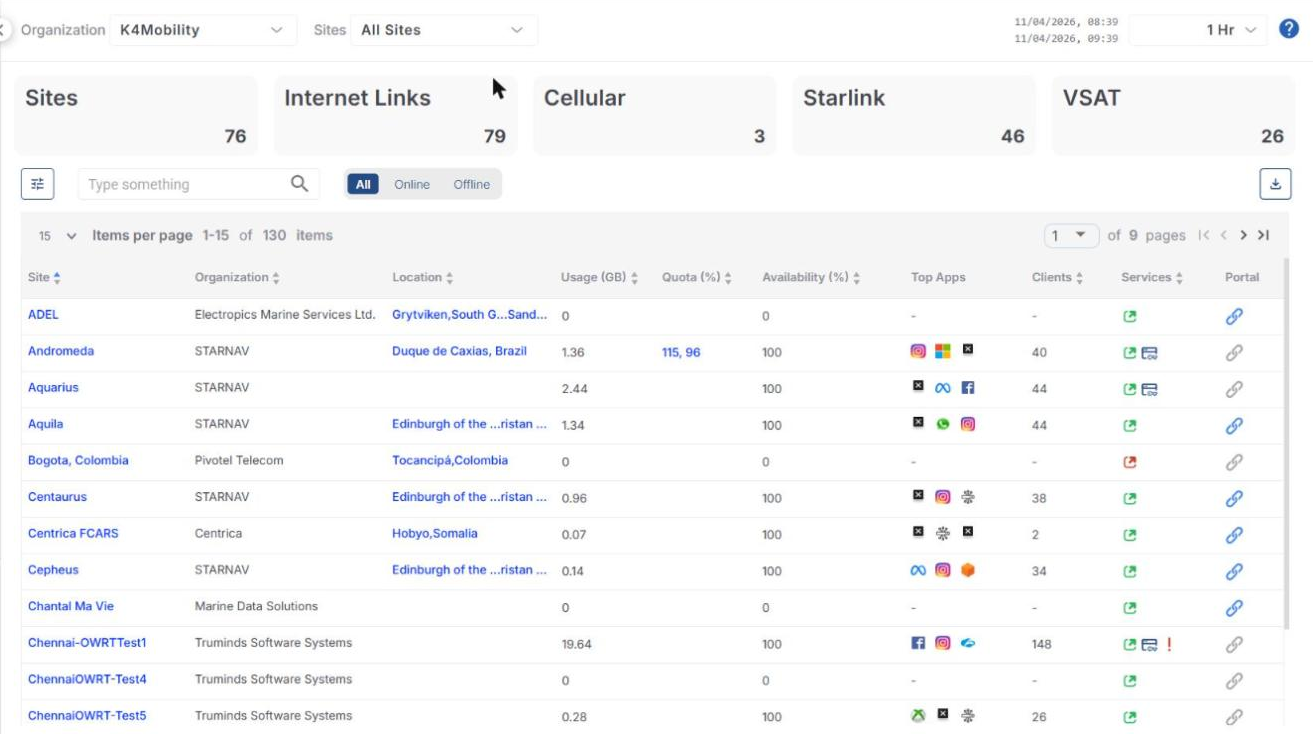
The Sites screen is the landing page of Kognitive Cloud. The user is automatically directed to the Sites screen after login. This screen shows an SD-WAN summary of the sites within an organization. It shows a high-level overview and summary data of all of an Organization’s sites.
-
In the Organization field, select the Organization or sub-organization from the dropdown menu. The logged in admin Organization is populated by default here. This is the organization corresponding to the email ID used to login.
-
The dropdown list consists of all the sub-organizations under logged in admin organization.
-
In the Sites field, select the required sites from the dropdown menu. The dropdown menu consists of all the sites associated with the selected Organization and sub-organizations.
-
Select the Period if necessary.
-
The Sites screen shows data summary cards at the top. By default, the Sites, Internet Links, Cellular, Starlink and VSAT cards are shown. The cards to be displayed can be selected from the Cards section of the Filter panel. The available cards are:
-
Sites
-
Internet Links
-
Cellular
-
Starlink
-
VSAT
-
Wifi
-
Ethernet
-
LBand
-
Oneweb
-
Starlink_R
-
-
The Site table lists all the selected sites.
-
Each site can have multiple devices deployed on it and each device can have multiple WAN interfaces through which it obtains internet connectivity.
-
The Site table displays:
-
Site
-
Organization
-
Location
-
Usage (GB)
-
Quota (%) - Hover the cursor on the Quota value to view the quota details of the site such as Usage (%), WAN Alias, Quota Usage, Quota 1, Quota 2, Quota Max, Status, Period and Estimated Max Overage.

Quota details -
Availability (%)
-
Top Apps
-
Clients
-
Services
-

-
Internet Online / Internet Offline
-
-

-

-

-
-
Portal - Link to connect to the Edge Portal
-
-
The Type something search field can be used to search for the Sites based on the Site Name/Organization/Location.
-
Use the All / Online / Offline toggle to view all the sites or only the sites that are online or offline.
-
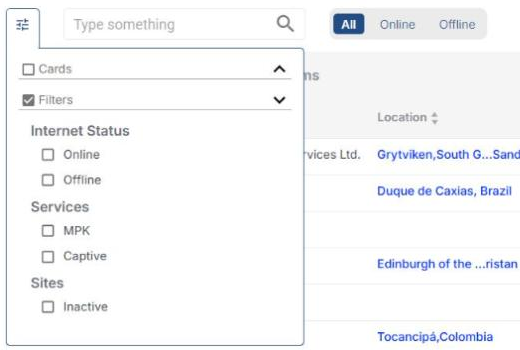
Click the Filter icon to open the Filter panel.
-
Cards - Select the summary cards to be displayed at the top of the screen.
-
Filters - Filter the Site table based on the following options:
-
Internet Status - Online / Offline
-
Services - MPK / Captive
-
Sites - Inactive (shows the inactive sites)
-
Sites filter -
-
Click the Download icon to download a local copy of the Site table information in CSV format.
Multi Path Kognitive (MPK)
-
Under the Services column, click the
-
The MPK feature will be available for the user only if any one/both of the following conditions are satisfied.
-
Advance Bonding should be enabled
-
VTP should be enabled in any interface
-
-
Using the MPK feature, the user can view the Internet Status of the Interfaces and WAN profiles for the selected site.
-
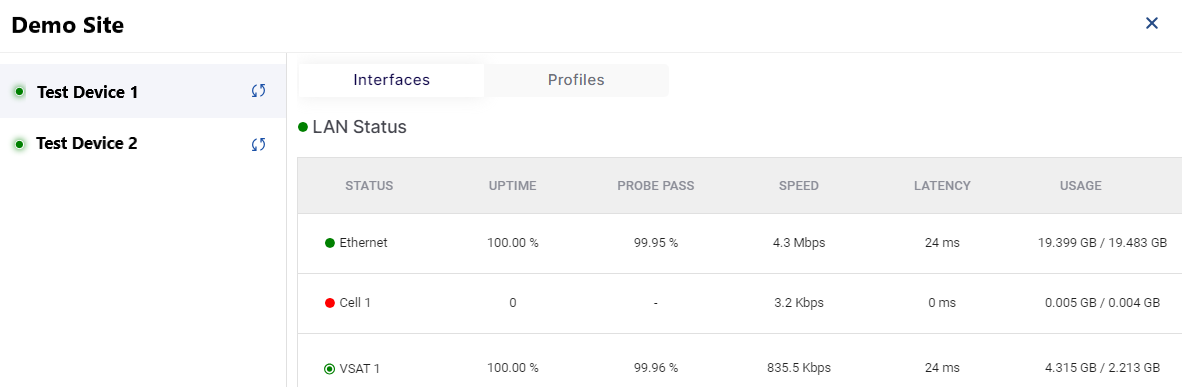
The dialog box opens as shown below:
-
On the left side of the dialog box, it shows the name of the selected site and lists all the devices deployed at the site.
-
Select the required device.
-
The right side of the dialog contains two tabs: Interfaces and Profiles.
Interfaces
-
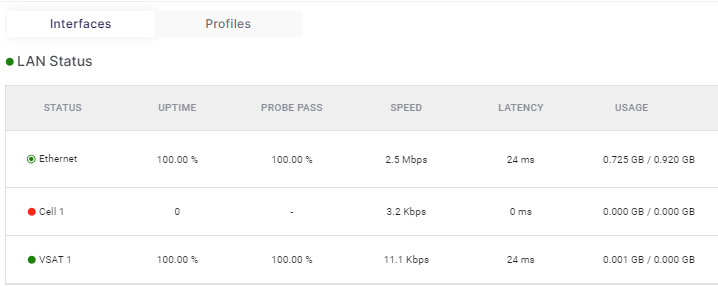
By default, Interfaces tab is selected. This tab show the Internet Status summary of all the Interfaces configured in the selected device.
-
It shows the following information:
-
Status - The list of all interfaces configured in the selected device. The color coding shows the Internet Status of these interfaces.
-

-

-

-

-
-
Uptime - Percentage of time that a link/interface is up.
-
Probe Pass - Percentage of successful probes in the given timeframe.
-
Speed - Internet speed or transfer rate, in Mbps.
-
Latency - RTT (Round Trip Time) it takes for a data packet to travel from the source to the destination and back again, in ms.
-
Usage - Total data consumed (download and upload), in GB.
-
Profiles
-
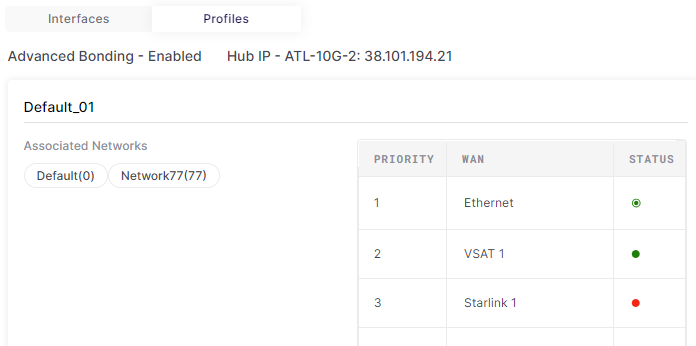
Click the Profiles tab to view the Internet Status summary of all the WAN Profiles configured in the selected device.
-
The dialog box shows the following information:
-
The list of WAN Profiles configured in the system
-
The Access Networks associated with the WAN Profiles
-
The priority order of the WAN Links for each WAN Profile
-
The Internet Status of each of the WAN Links. The color coding for the internet status is the same as mentioned in the above section.
-
Opening any Site from the Sites screen
-
The user can directly access each individual site and the devices present at the site, by clicking on the Site Name.
-
Select the required Site.
-
The following screens become available for the user:
In the site screen, the following tabs are shown at the top of the screen: Topology, Alerts, Alerts - Config, Notes, Events, SDWAN, Remote Connections, System Health and HA. The HA tab is shown only when the site has more than one server device of the same type. The Flights tab is shown only for aviation sites with the Flights feature enabled. Tabs marked with an asterisk (*), such as Internal Alerts *, are restricted features and are not covered in this guide. Click the back arrow (←) to return to the Sites screen.