
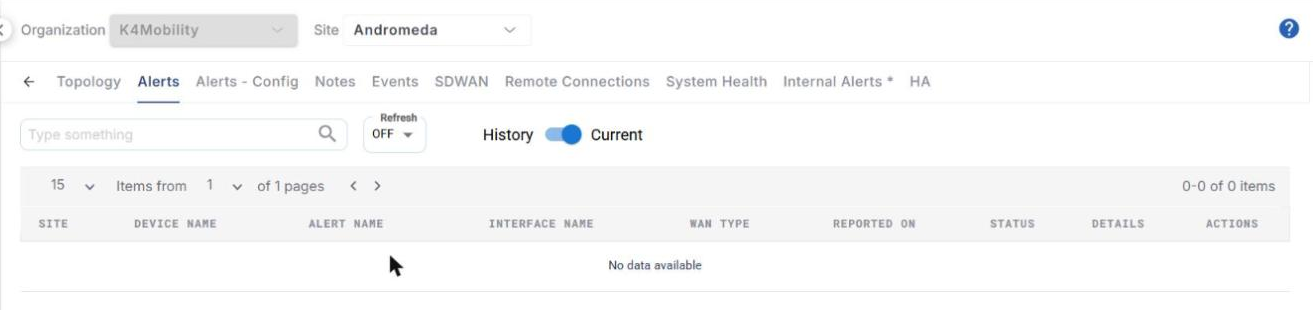
The Alerts tab shows the summary of all the alerts raised for the user’s account. It shows the Alerts and their information in a table as shown in Figure Alerts Tab.
-
By default, the table only shows the current alerts - Alerts that are currently in Alerting status.
-
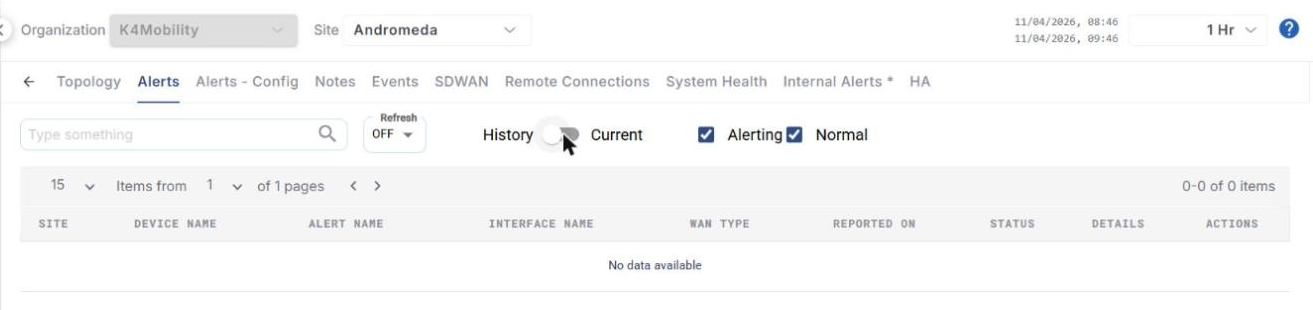
Click the History / Current toggle button and switch it to History to show the history of both the Normal and Alerting alerts as shown in Figure Alerts History.
-
In the History view, select the Period from the time range dropdown at the top right corner of the screen if necessary.
-
The Alerts table shows the following information:
-
Site - Name of the Site
-
Device Name - Name of the device
-
Alert Name - Name of the Alert
-
Interface Name - Name of the Interface
-
WAN Type - Type of WAN Interface that received the alert
-
Reported On - Date and Time of the alert
-
Status - Status of the Alert (Alerting / Normal)
-
Details - Shows the Metadata code with details such as Device ID, Site ID, Type.
-
Actions - Actions that can be performed on the alert
-
-
Select the Alerting or Normal checkbox to filter the table based on the Status of the alerts. These checkboxes are available only in the History view.
-
The Type something search field can be used to search for the alert based on the Site/Device name/Alert name/Interface name/WAN Type.
-
In the Refresh field, select the time interval (1m, 5m or 15m) for automatically refreshing the alerts table. Select OFF to disable the automatic refresh. By default, the Refresh is set to OFF.