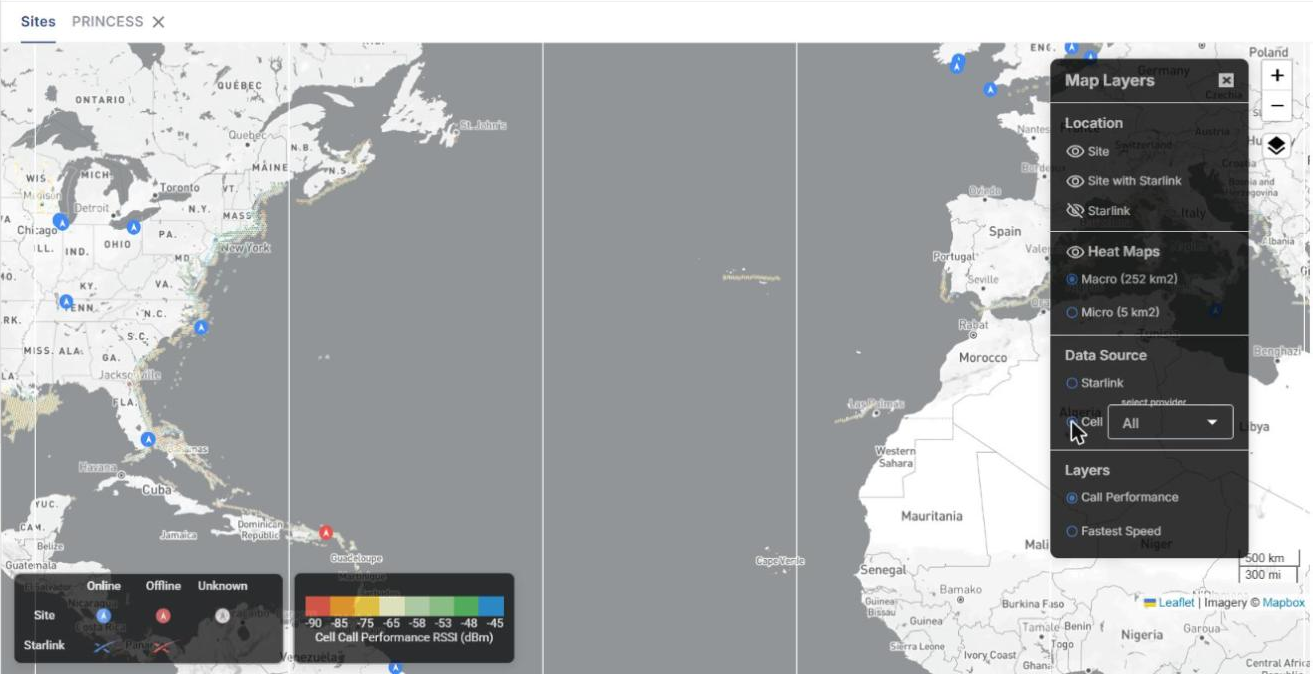
The Map screen shows the geographical location of each site and Starlink terminal of the selected organization. It also shows historical connectivity performance (latency, speed, drop percentage and cellular signal strength) as hexagonal heat maps, so you can see how connectivity performs across different regions.
-
Select Map from the left menu of Kognitive Cloud.
-
In the Organization field, select the organization or sub-organization. The organization of the logged-in user is selected by default, and the list contains all of its sub-organizations.
-
In the Sites field, select the required sites (default: All Sites). The list contains all sites of the selected organization and its sub-organizations.
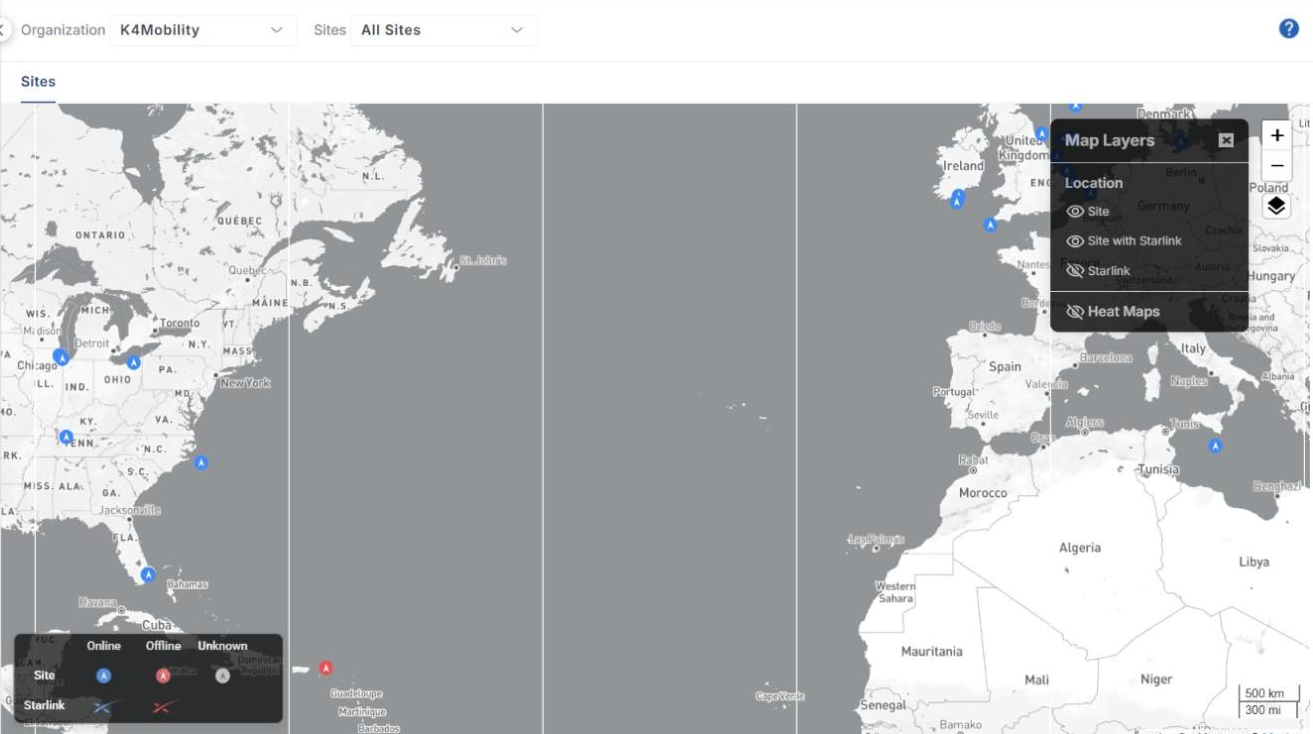
Map legend and controls
-
The legend at the bottom-left corner shows the status colours of the markers:
-
Site – Online (blue), Offline (red) and Unknown (grey).
-
Starlink – Online (blue) and Offline (red).
-
-
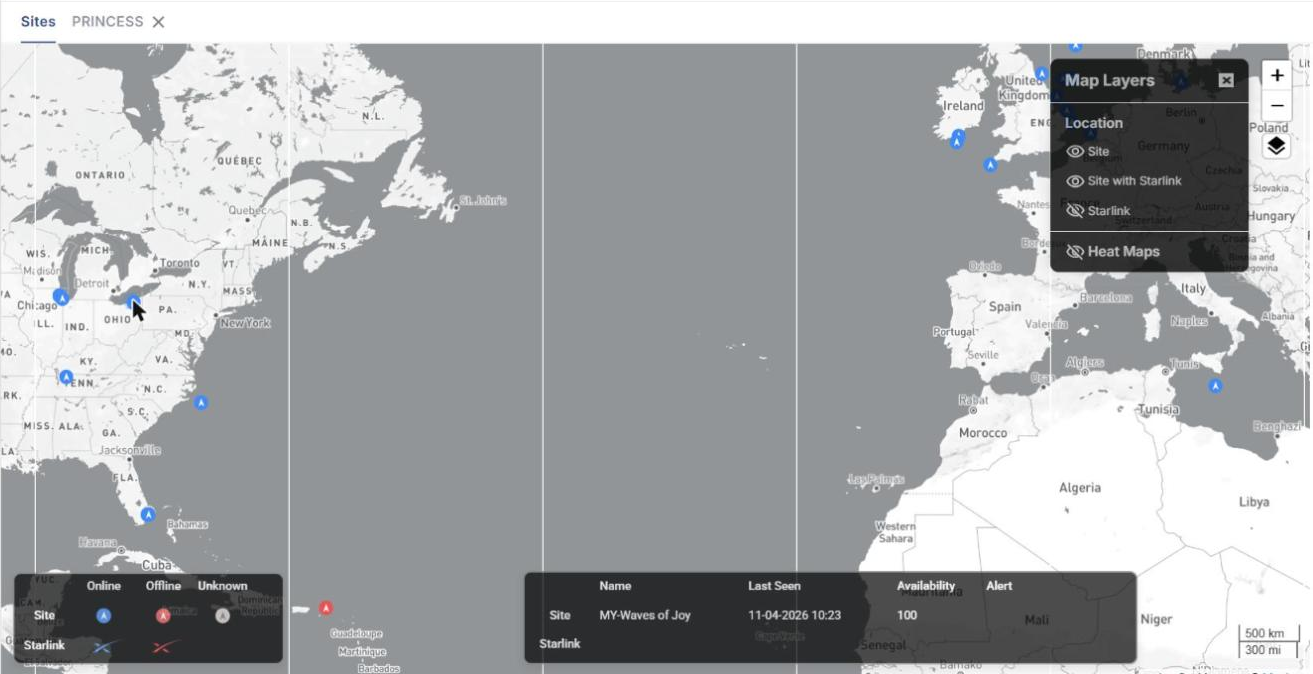
Hover over a site marker to see its name.
-
Click + / - on the right side of the map to zoom in or out, or use the mouse wheel. Click and drag the map to pan.
-
Click the Layers icon to open or close the Map Layers panel.
Map Layers
The Map Layers panel is open by default. Click the eye icon next to a layer to show or hide it.
-
Location
-
Site – sites (shown by default).
-
Site with Starlink – sites that have a Starlink terminal (shown by default).
-
Starlink – Starlink terminal locations (hidden by default).
-
-
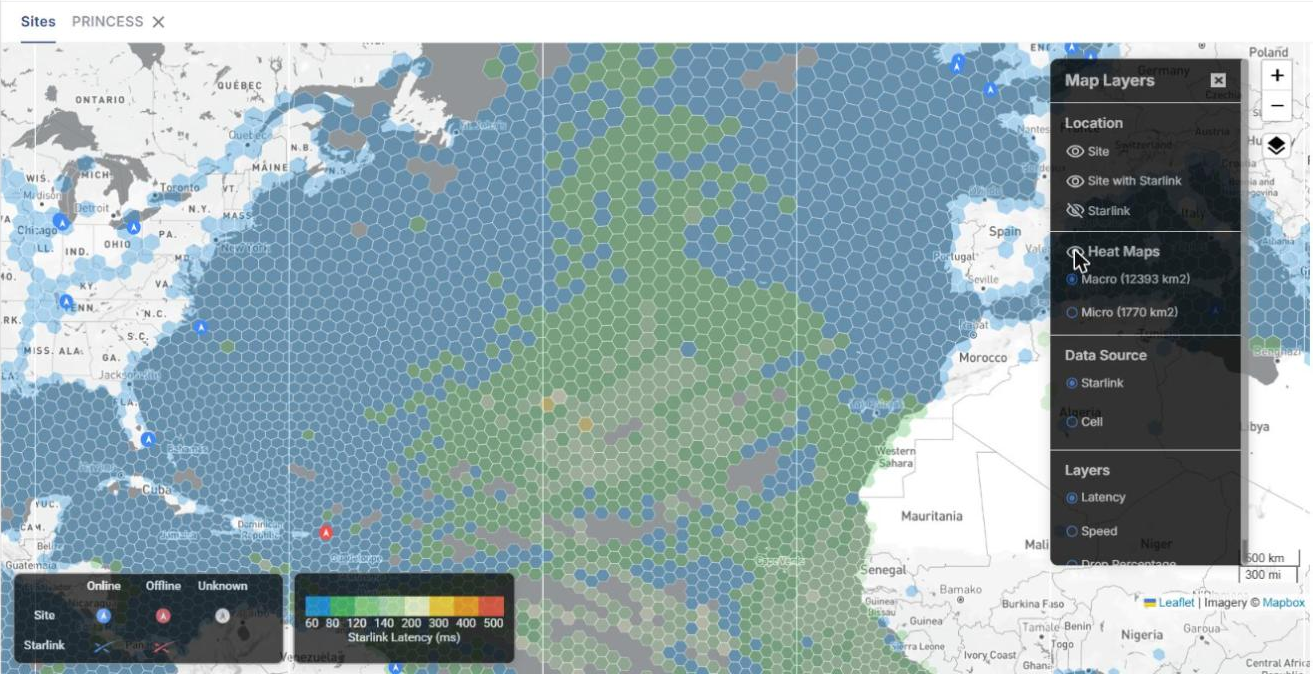
Heat Maps – hexagonal performance layers (hidden by default). See Heat Maps below.
Site details
-
Click a site marker to open the details bar at the bottom of the map. It shows the Name, Last Seen time, Availability (%) and Alert status for the Site and its Starlink terminal.
-
Clicking a site also opens a new tab with the site name next to the Sites tab. Click the X on the tab to close it.
In the site tab:
-
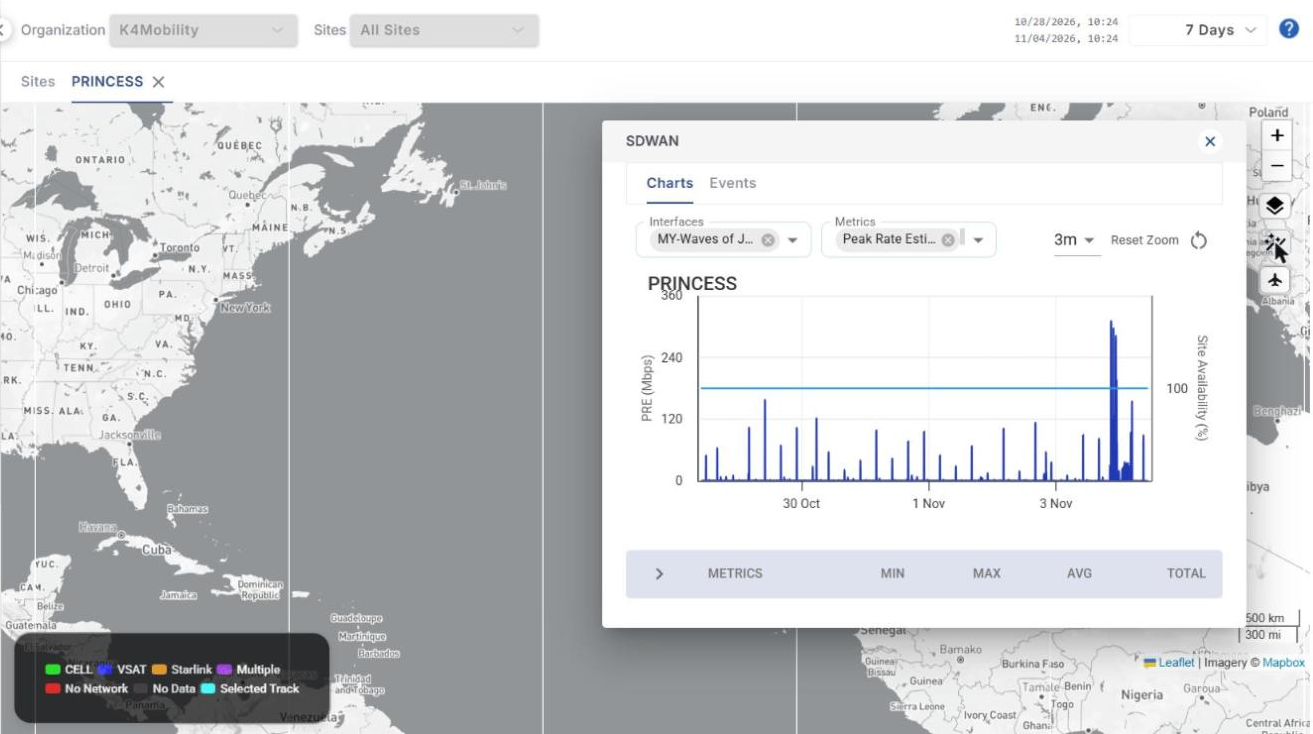
The Organization and Sites filters are locked to the site, and a period selector (default 7 Days) is available at the top-right.
-
The track of the site for the selected period is drawn on the map. The legend shows the track colour for each connection type: CELL, VSAT, Starlink, Multiple, No Network, No Data and Selected Track.
-
Layers – shows or hides Heat Maps on the site tab.
-
Auto Chart – opens the SDWAN panel with two tabs:
-
Charts – select Interfaces and Metrics (for example Peak Rate Estimate) to plot them for the selected period together with Site Availability (%). Use the interval dropdown and Reset Zoom as required. The table below the chart shows the Min, Max, Avg and Total of each metric.
-
Events – lists the SDWAN events of the site (Timestamp, DID, Source, Level, Module, Description, Metadata) with a Filter option.
-
-
Flight Table (aircraft icon) – shows the flights of aircraft sites. See the Flights page for details.
Heat Maps
Heat Maps divide the map into hexagons and colour each hexagon by its historical performance value, so you can analyse each area separately. Turn on Heat Maps in the Map Layers panel to display them, then select the options below.
-
Heat map size – Macro analyses a larger area and Micro a smaller one. The hexagon size depends on the data source:
-
Starlink – Macro 12393 km², Micro 1770 km².
-
Cell – Macro 252 km², Micro 5 km².
-
-
Data Source – Starlink or Cell.
-
Layers – the performance metric to display. The available layers depend on the data source.
Layers for Starlink
|
Layer |
Description |
Legend |
|---|---|---|
|
Latency |
Latency measured in each area. |
Starlink Latency (ms): 60 – 500 |
|
Speed |
Internet speed measured in each area. |
Starlink Speed (Mbps): 1 – 75 |
|
Drop Percentage |
Percentage of dropped connectivity in each area. |
Drop Percentage (%) |
-
The legend at the bottom of the map shows the colour code for each value of the selected layer.
-
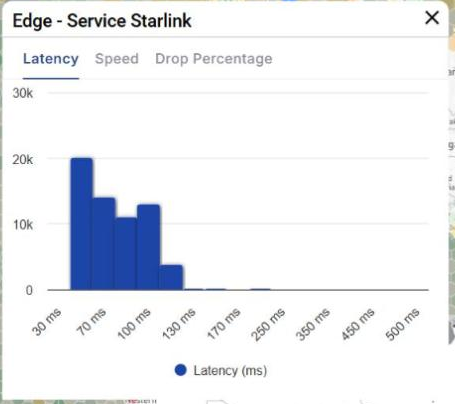
Click any hexagon to open a bar chart (histogram) of the performance values recorded in that area. Use the Latency, Speed and Drop Percentage tabs to switch between metrics.
Layers for Cell
-
Select Cell under Data Source. A select provider dropdown appears (default All). Select a provider (for example AT&T, Vodafone, T-Mobile or Verizon) to show only the hexagons where that provider was used.
-
The layers available for Cell are:
-
Call Performance – coloured by the cellular signal strength (RSSI) recorded in the area. Legend: Cell Call Performance RSSI (dBm), -90 to -45 dBm.
-
Fastest Speed – coloured by the fastest cellular speed recorded in the area. Legend: Cell Fastest Speed (Mbps), 1 to 75 Mbps.
-