
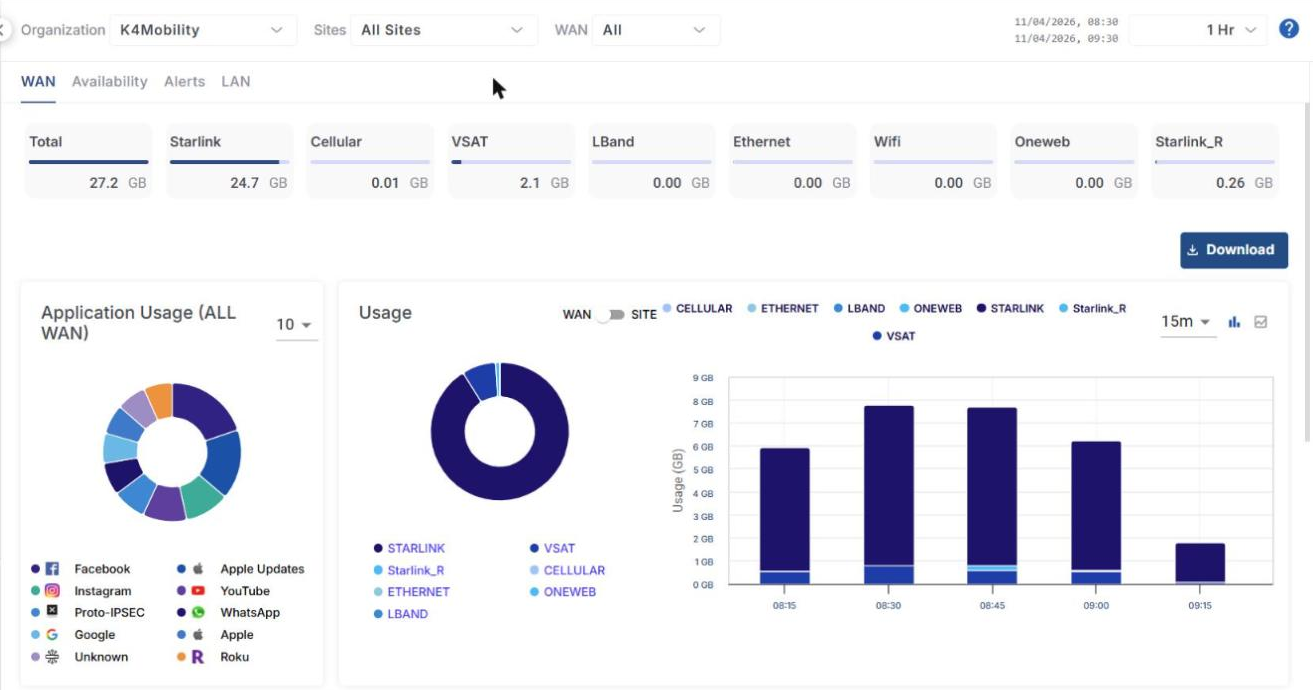
The WAN tab (Usage) is selected by default in the Trends screen. It shows a summary of the WAN usage across the filter selection, the Top Applications usage and a historical chart of usage by WAN type.
Headers
The headers at the top of the screen show the total amount of data (in GB) consumed by the selected organization or sub-organization through each WAN source during the selected period:
-
Total – Total data consumed through all the WAN sources
-
Starlink, Cellular, VSAT, LBand, Ethernet, Wifi, Oneweb and Starlink_R – Data consumed through the corresponding WAN source. The bar below the value shows the share of the total usage.
-
Click the Download button below the headers to download the usage data in CSV format.
Application Usage (All WAN)
-
The Application Usage pie chart shows the amount of data consumed by the different applications through all WAN sources. Hovering the cursor on any item on the pie chart highlights the application and shows the amount of data consumed by that application.
-
Click the dropdown menu (10 by default) to change the number of applications displayed on the chart.
Usage
-
The Usage pie chart shows the amount of data consumed through the different WAN sources. Hovering the cursor on any item on the pie chart highlights the WAN source and shows the amount of data consumed through it.
-
Click the WAN / SITE toggle button to view the pie chart and bar chart based on the different sites of the organization.
-
All the blue highlighted text in the Usage section is clickable. It can be the name of a WAN source or Site. Clicking it filters the entire screen and displays the data usage information corresponding only to that WAN source or Site.
-
The chart on the right displays the amount of data consumed through the WAN sources at different time instances. The horizontal axis contains the time instances, and the vertical axis contains the amount of data. The legend above the chart shows the WAN sources plotted in the chart.
-
Select the chart interval (for example, 15m) from the interval dropdown. The available intervals depend on the selected period.
-
Click the Bar chart or Line chart icon to view the chart in bar or line format.
Site Statistics
-
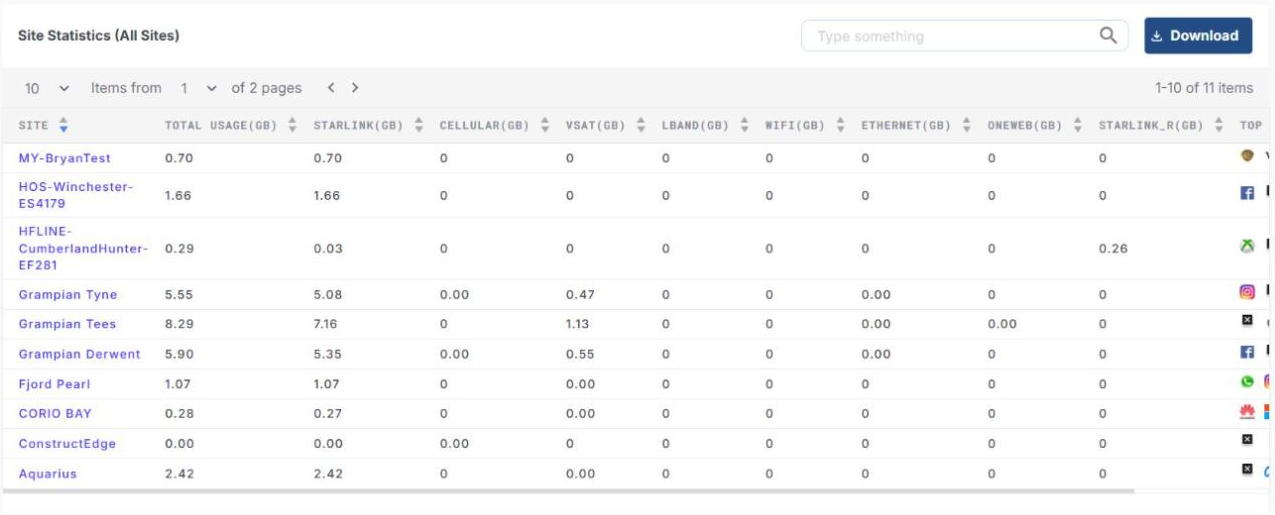
The Site Statistics section shows a table that lists the sites under the selected organization and their data consumption.
-
The table shows the following information:
-
Site – Name of the Site
-
Total Usage (GB) – Total amount of data consumed by the site through all WANs
-
Starlink (GB), Cellular (GB), VSAT (GB), LBand (GB), Wifi (GB), Ethernet (GB), Oneweb (GB) and Starlink_R (GB) – Amount of data consumed through the corresponding WAN for that site
-
Top Usage Apps – The top applications that consumed the maximum amount of data in that site through all WANs
-
-
Enter the required text in the Type something search field to search the table.
-
Click a column header to sort the table based on that column.
-
Use the Items from dropdown to change the number of sites displayed in one page, and use the < > buttons or the page dropdown to move between the pages.
-
Click Download to download the table data in CSV format.