-
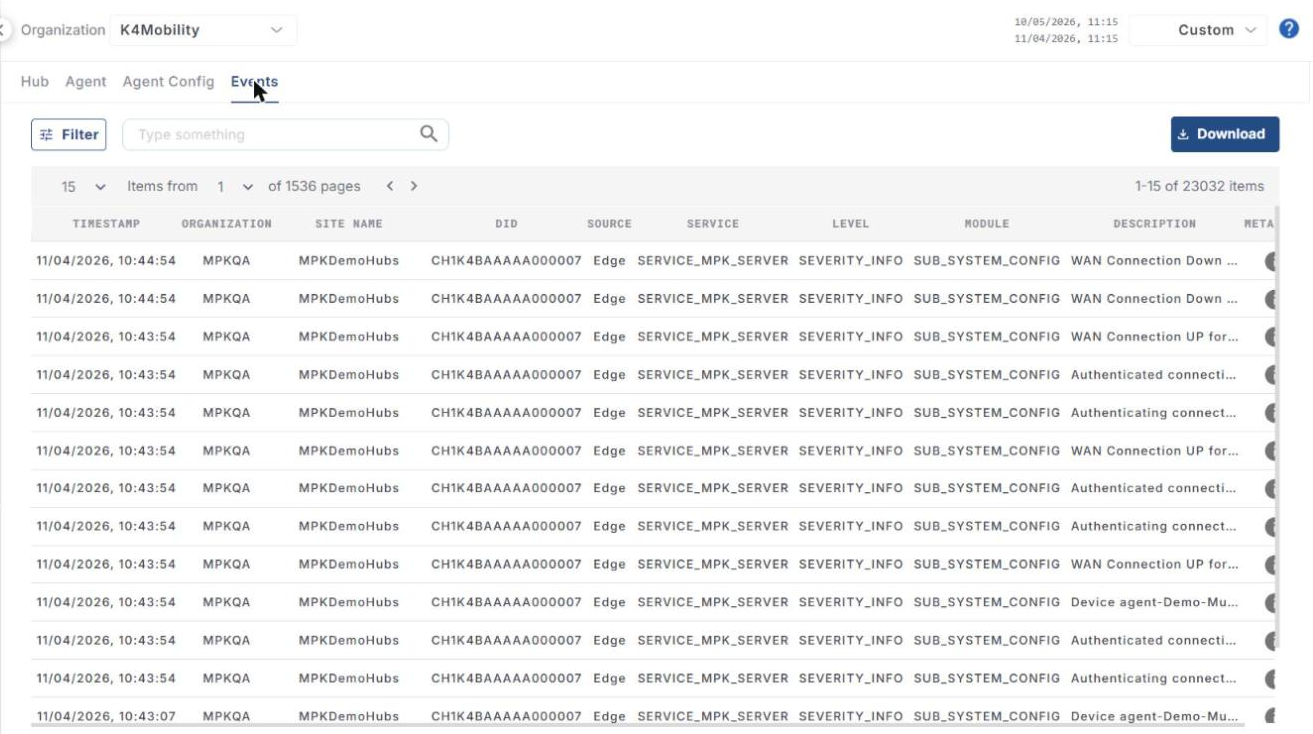
Select the Events tab to view all the events logged by the hubs and services of the selected organization for the selected period.
-
The table shows the following information:
-
Timestamp – date and time of the event.
-
Organization – name of the organization.
-
Site Name – name of the site.
-
DID – device ID.
-
Source – source of the event (Edge or AgentController).
-
Service – service that logged the event (for example SERVICE_MPK_SERVER).
-
Level – severity level of the event.
-
Module
-
Description – description of the event.
-
Metadata – click the info icon to view the event details.
-
-
Use the search field to find specific events.
-
Click Download to download the events.
-
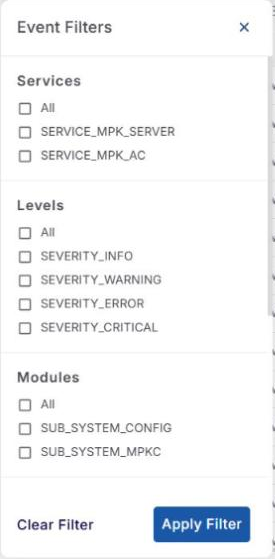
Click the Filter button to open Event Filters and filter the table by:
-
Services (SERVICE_MPK_SERVER, SERVICE_MPK_AC)
-
Levels (SEVERITY_INFO, SEVERITY_WARNING, SEVERITY_ERROR, SEVERITY_CRITICAL)
-
Modules (for example SUB_SYSTEM_CONFIG, SUB_SYSTEM_MPKC)
-
Devices
-
Sources (Edge, AgentController)
-
-
Each filter group has an All option. Select the required values and click Apply Filter, or click Clear Filter to remove the filters.