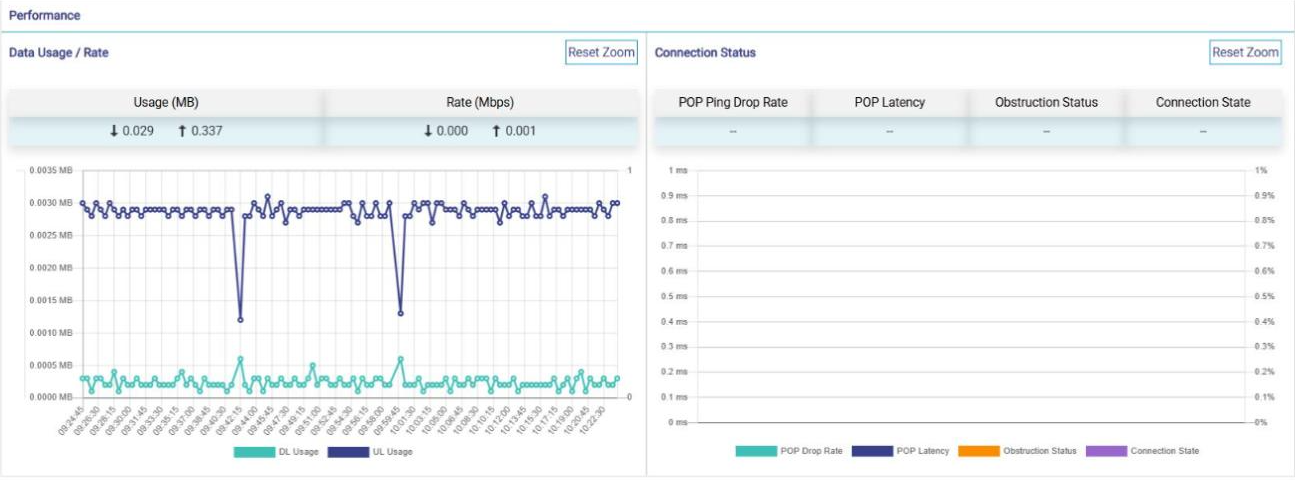
KonnectOS can monitor Starlink terminals connected to the Edge system. When a Starlink interface is configured as Managed Starlink, the KonnectOS system reads the data from the Starlink modem and shows it on the Starlink controller screen (Controllers > Starlink 1, Starlink 2, and so on).
Configuring a Starlink Interface
To configure a Starlink interface, perform the following steps.
-
Log in to the KonnectOS Portal.
-
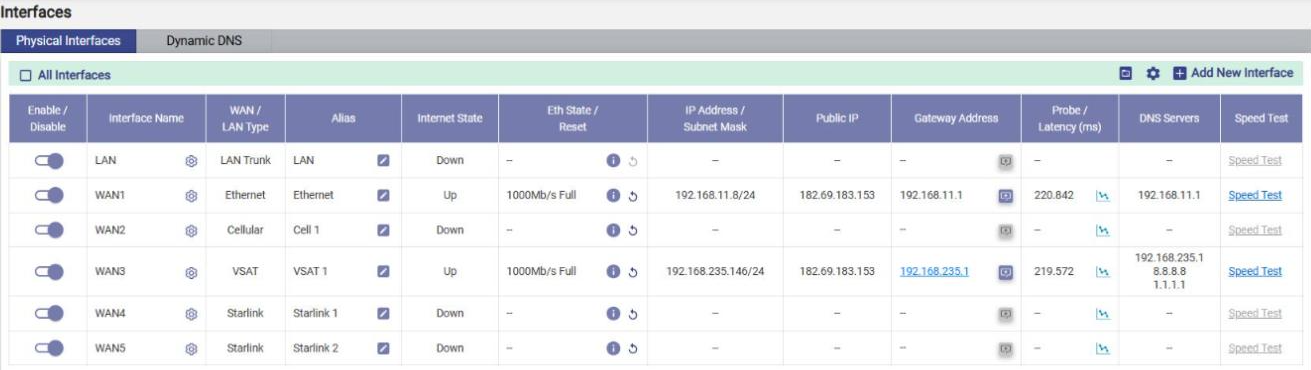
Click the Interfaces option from the side menu bar. The Physical Interfaces page appears, see figure below.
-
Details of the Interfaces present on the KonnectOS System are listed on the Interfaces page. By default, only enabled Interfaces are shown. To see all the interfaces, select the All Interfaces check box.
-
Remove the WAN Interface to be updated from all WAN Profiles.
-
Click the Toggle icon and disable the WAN Interface. The configuration of an interface can be edited only when the interface is disabled.
-
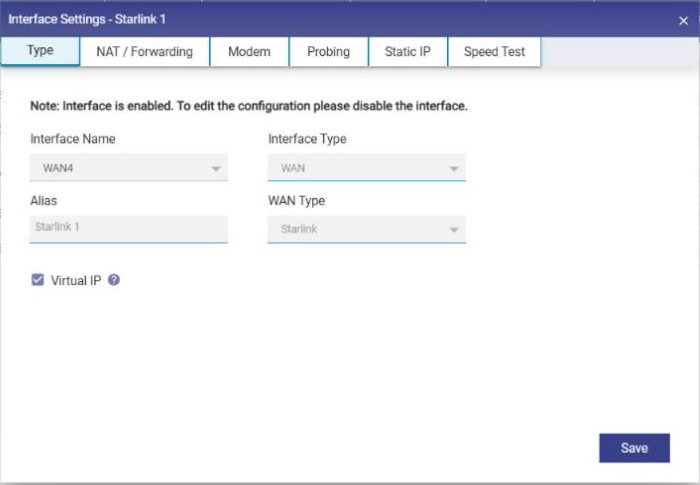
Click the Gear icon next to the Interface. The Interface Settings dialog box opens on the Type tab, see figure below. The dialog box contains the Type, NAT / Forwarding, Modem, Probing, Static IP and Speed Test tabs.
-
Check the Interface Name.
-
Select the Interface Type as WAN.
-
Select the WAN Type as Starlink.
-
Enter the Alias name for the Interface (for example, Starlink 1).
-
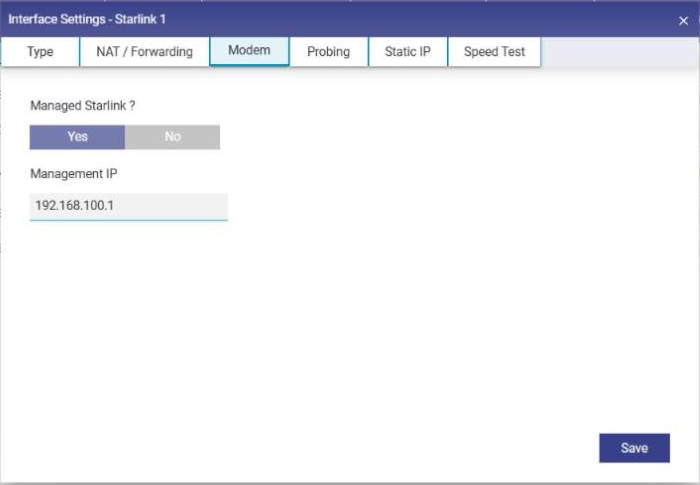
Click the Modem tab, see figure below.
-
Under Managed Starlink ?, click Yes.
-
The Management IP of the Starlink modem is populated by default (192.168.100.1). Change it only if the modem uses a different management IP address.
-
Click Save.
-
Click the Toggle icon and enable the WAN Interface.
-
Add the interface back to the required WAN Profiles.
The data is now fetched from the Starlink modem and displayed on the Starlink controller screen. To view it, select Controllers from the side menu bar and click the Starlink tab of the interface.
Starlink Controller Screen
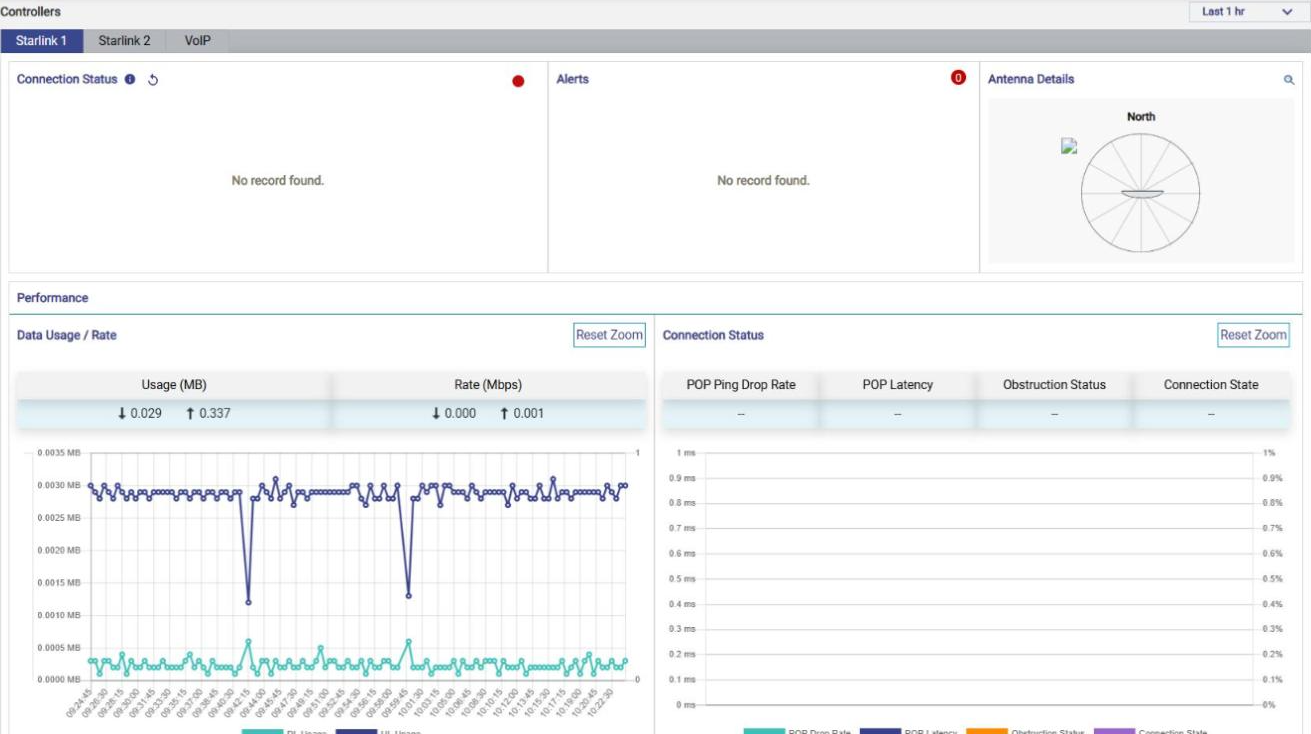
The Starlink controller screen shows the status, alerts, antenna details and performance of the Starlink terminal, see figure below. The time period of the charts is selected from the period drop-down at the top right of the Controllers screen (default Last 1 hr). For details, see Controllers.
|
Section |
Description |
|---|---|
|
Connection Status |
Shows the connection details reported by the Starlink terminal. The status indicator at the top right of the panel shows whether the terminal is connected (green) or not connected (red). Point to the information (i) icon to view the configuration details, and click the Refresh icon to refresh the panel. If no data is available, No record found. is displayed. |
|
Alerts |
Shows the alerts reported by the Starlink terminal. The badge at the top right of the panel shows the number of active alerts. |
|
Antenna Details |
Shows the orientation of the Starlink antenna relative to North. Click the Search (magnifier) icon at the top right of the panel to view more details. |
|
Performance – Data Usage / Rate |
Shows the download and upload Usage (MB) and the current download and upload Rate (Mbps), with a chart of DL Usage and UL Usage over the selected period. |
|
Performance – Connection Status |
Shows the POP Ping Drop Rate, POP Latency, Obstruction Status and Connection State of the Starlink terminal, with a chart of these values over the selected period. |
After zooming in on a chart, click Reset Zoom to return to the full period.