
OrbitBills
OrbitBills is a comprehensive invoicing and plan management platform designed to streamline billing operations for Starlink service lines. It provides administrators and finance teams with tools to manage pricing, generate and track monthly invoices, post payments, and oversee Starlink contact details for accurate and timely communication. Users can track revenue from both recurring services and one-time products, and analyze performance through interactive visual reports.
The intuitive dashboard offers an at-a-glance view of organizational metrics—such as number of Subscriptions, plan breakdowns, and outstanding balances—while built-in reporting features deliver valuable insights into revenue trends and profitability. OrbitBills ensures transparency, accuracy, and efficiency in every step of the billing process, making it an essential tool for organizations managing Starlink plans.
Features of OrbitBills
Plans are pulled from the Starlink Cloud section of Kognitive Cloud and displayed in OrbitBills
OrbitBills manages Prices for various available Plans including maintaining history for any changes made to the Pricing
Pricing of the Plans can only be Edited by the Finance Contact of the Organization – But can be viewed by all others
Generating Monthly Invoices for Custom Plans
Monitors Post payments against invoices maintaining comprehensive history of payments made (Amount, Date, User, IP Address)
Managing the Starlink Contacts and their addresses for receiving the invoices
This allows sending invoices to the specific email contacts of the Organizations
The Dashboard shows the following details of each Organization:
# Of Starlink Kits
# of Devices
# of Custom Starlink Plans
# of Standard Starlink Plans
Outstanding Invoice Balance
Multiple Reports provided
Organization Wise Revenue with # of Service Lines
Month Wise Revenue – can be magnified for select organizations
Profitability of Plans (in Progress – Update by Jun 23)
Allows any user to Create Tickets on the Parent Organization which is managing the Overall Software.
Login
Use the https://kap3p.kognitive.net/ URL to access the OrbitBills application.
The Login Screen enables the user to login into their account.
The users can access the account using valid credentials.
Enter the below details:
Username
Password
Click LOG IN to login into the account.
OrbitBills Login
OrbitBills Homepage
Clicking the LOG IN button opens the OrbitBills Homepage.
OrbitBills Homepage
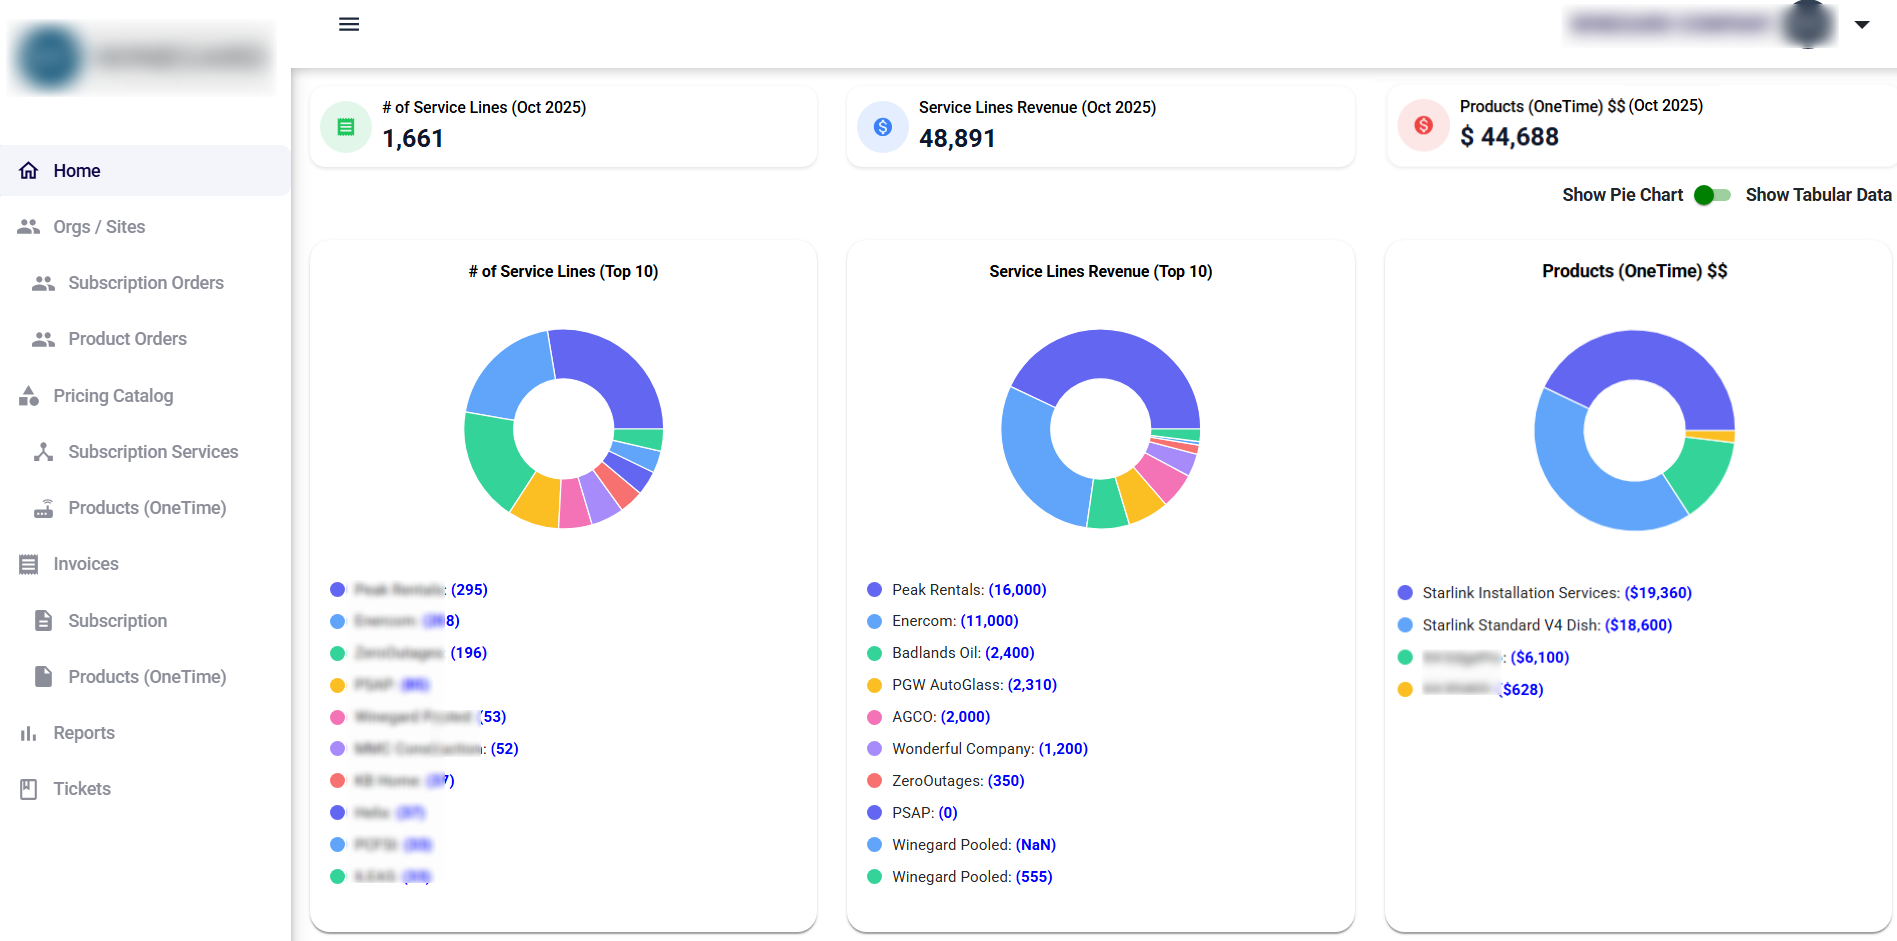
The Home page serves as the central dashboard of OrbitBills, providing a real-time overview of the number of service lines, revenue, and product sales for the selected month. It offers key insights at a glance through visual charts and summary metrics.
Headers
The Headers show the following information:
# of Service Lines – Displays the total number of active service lines for the current month.
Service Lines Revenue – Shows the total revenue generated from service lines in the current month.
Products (OneTime) $$ – Shows total revenue generated from one-time product sales in the current month.
The Charts show the following information:
# of Service Lines
The # of Service Lines pie chart shows the number of active service lines under each sub organization. The top 10 sub organization in terms of number are listed in this section.
The legend given below the chart is color-coded and shows the sub organization name and the number of service lines associated with it.
Service Lines Revenue
The Service Lines Revenue pie chart shows the revenue contribution per sub organization.
The legend given below the chart shows thesub organization name and the total revenue generated by it in USD.
Products (OneTime) $$
The Products (OneTime) pie chart shows the revenue from one-time product sales.
The legend given below the chart shows the Product name and the total revenue generated by the product in USD.
Tabular Data
Click the Show Tabular Data toggle button
 to view the data table.
This table provides a clear overview of the number of service lines associated with each plan, the type of plan, and the total revenue generated from it.
The legend given above the table is color-coded and shows the type of plan - Standard / Custom / Sub Pool.
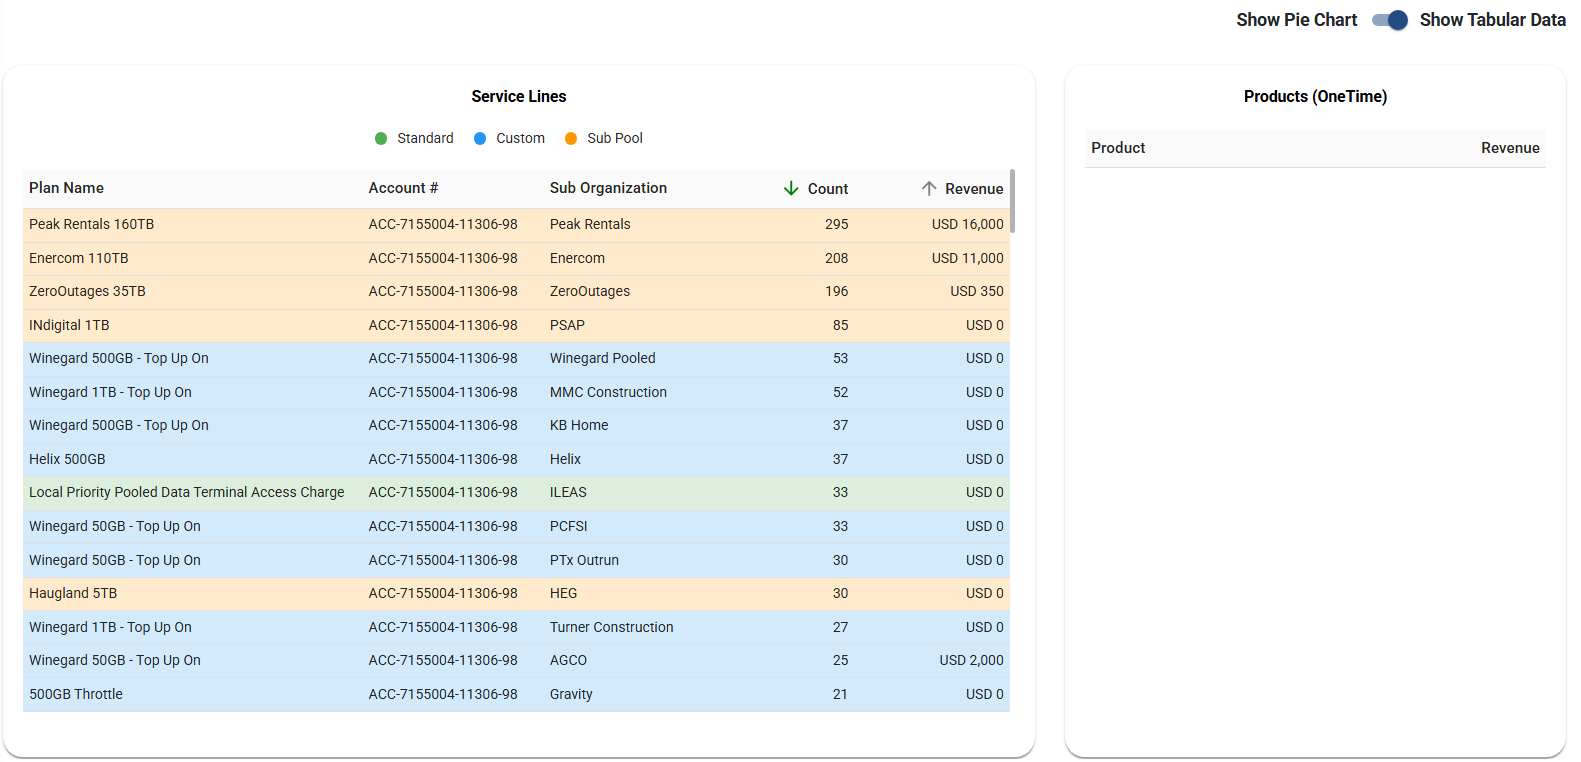
Tabular Data
The table shows the following information:
Plan Name - Name of the Plan
The color coding shows the type of the plan.
Account Number - Service Account Number
Sub Organization - The sub organization associated with the plan
Count - The number of service lines associated with the plan
Revenue - The total revenue generated from the specific plan under the respective sub-organization.
The OrbitBills application consists of the below screens. The functions of these screens are explained in the following pages: