
Usage
The Usage tab by default shows the Top 10 Applications Usage, a summary of WAN usage across the filter selection, and a historical bar chart of usage by WAN type.
Headers
It also shows headers with the following information:
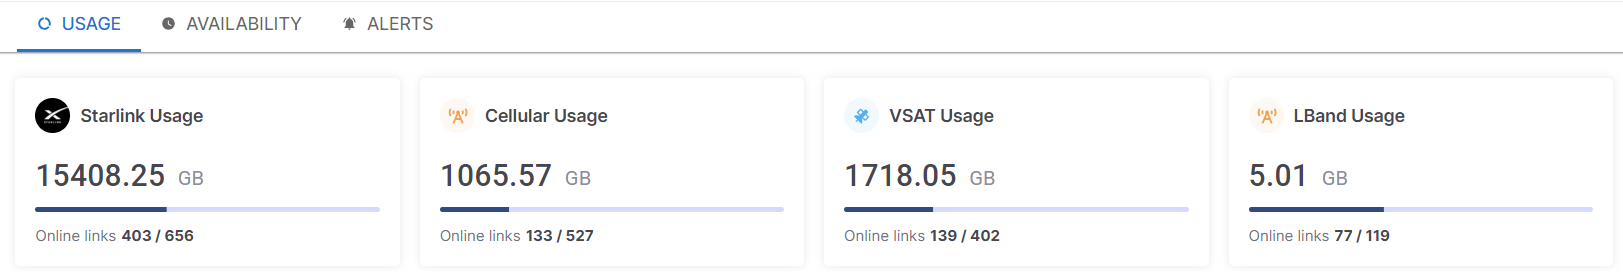
Usage - Headers
Starlink Usage – The total amount of data consumed by the selected organization or sub-organization through the Starlink WAN Source in GB. The number of Online links out of total links is also shown below.
Cellular Usage – The total amount of data consumed by the selected organization or sub-organization through the Cellular WAN Source in GB. The number of Online links out of total links is also shown below.
VSAT Usage – The total amount of data consumed by the selected organization or sub-organization through the VSAT WAN Source in GB. The number of Online links out of total links is also shown below.
LBand Usage – The total amount of data consumed by the selected organization or sub-organization through the LBand WAN Source in GB. The number of Online links out of total links is also shown below.
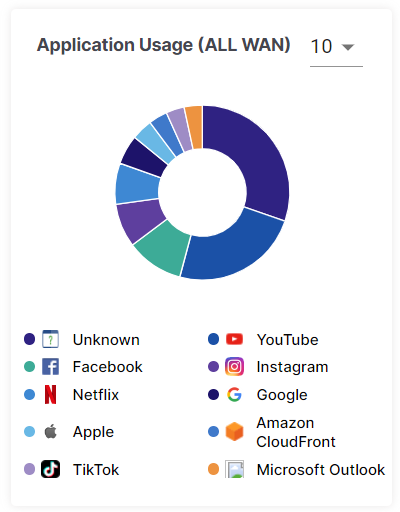
Application Usage (All WAN)
The Applications Usage pie chart shows the amount of data consumed by the different applications through all WAN sources. Hovering the cursor on any item on the pie chart highlights the application and shows the amount data consumed by that application in GB.
Click the dropdown menu to change the number of applications displayed on the chart.
Application Usage (All WAN)
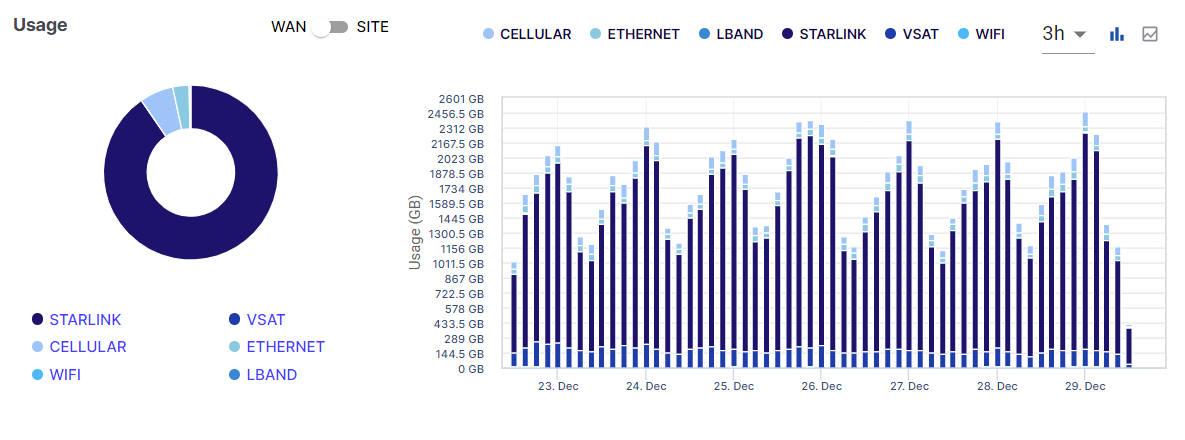
Usage
The Usage pie chart shows the amount of data consumed through different WAN sources. Hovering the cursor on any item on the pie chart highlights the WAN source and shows the amount data consumed through it in GB.
Usage
Click the WAN/SITE Toggle button to view the pie chart and bar chart based on the different sites of the organization.
All the blue highlighted text in the Usage screen is clickable. It can be the name of a WAN source or Site. Clicking it filters the entire screen and displays the data usage information corresponding only to that WAN source or Site.
This section also shows a bar chart that displays the amount of data consumed through the WAN sources at different time instances. The horizontal axis contains the time instances, and the vertical axis contains the amount of data in GB. The graph between these two axes gives the user a clear understanding of how the data has been consumed over the given time period.
Click Line chart icon to view the chart in line format.
Sites
The Sites section shows a table that lists all the sites under the selected organization and their data consumption. The Table shows the following information:
Site – Name of the Site.
Starlink – Total amount of data consumed through Starlink WAN for that site.
Cellular – Total amount of data consumed through Cellular WAN for that site.
VSAT – Total amount of data consumed through VSAT WAN for that site.
LBand – Total amount of data consumed through LBand WAN for that site.
Top Usage Apps – The top 3 applications that consumed the maximum amount of data in that site through all WANs.
-20231229-140217.png?inst-v=f7973c5e-4720-4374-88d5-68e50f2b6491)
Sites
Click the dropdown given below the Sites heading to change the number of sites displayed in one page. The pagination helps the user navigate to the next page by using the < > buttons or click the dropdown menu to move to the intended page.
Click Download to download the table data in CSV format.