Top Threats

Top Threats
The Top Threats tab is selected by default.
The cards show the following information:
Threat Summary - The total number of Threats received across the selected Organizations. It also shows the number of Classes of threats involved and the number of Affected Sites. Classes are nothing but the categories of Threats. Threats have various categories. These categories will be explained in following sections.
Critical - The total number of Critical severity Threats received.
High - The total number of High severity Threats received.
Medium - The total number of Medium severity Threats received.
Low - The total number of Low severity Threats received.
Threats By Severity
The Threats By Severity pie chart shows the percentage of threats based on their Severity level. Hovering the cursor on any item on the pie chart highlights the severity and shows the percentage of the selected item.
Threats By Action
The Threats By Action pie chart shows the percentage of threats based on their Action taken. The actions available in the system are Allow and Block. Hovering the cursor on any item on the pie chart highlights the severity and shows the percentage of the selected item.
The Classes of the received threats is displayed on the right with a cross bar chart denoting the number of Threats in each category. Click the dropdown menu to change the number of classes displayed on the chart.
Click theicon to view a time series bar chart of the Threats. This chart that displays the number of threats received at different time instances. The horizontal axis contains the time instances, and the vertical axis contains the number of Threats. The graph between these two axes gives the user a clear understanding of how many threats received over the given time period.

Time Series Chart
Top Threats
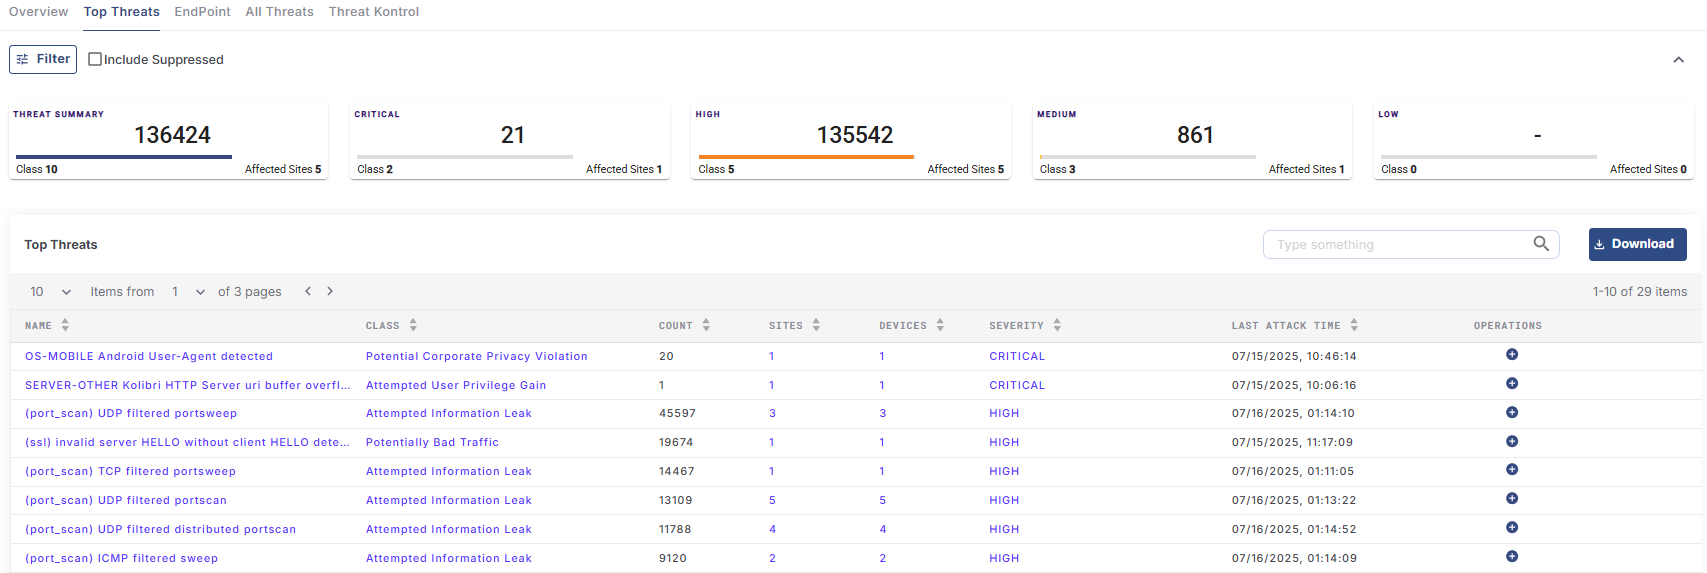
The Top Threats section shows a table that lists the Classes that received the highest number of threats for the selected organization and their counts. The Table shows the following information:
Name - Name of the Threat.
Class - Class of the Threat.
Count - Number of Threats received in that Class.
Sites - Number of Sites affected.
Devices - Number of Devices affected.
Severity - Severity level of the Threat.
Last Attack Time - Date and Time of the last threat received in that class

Top Threats
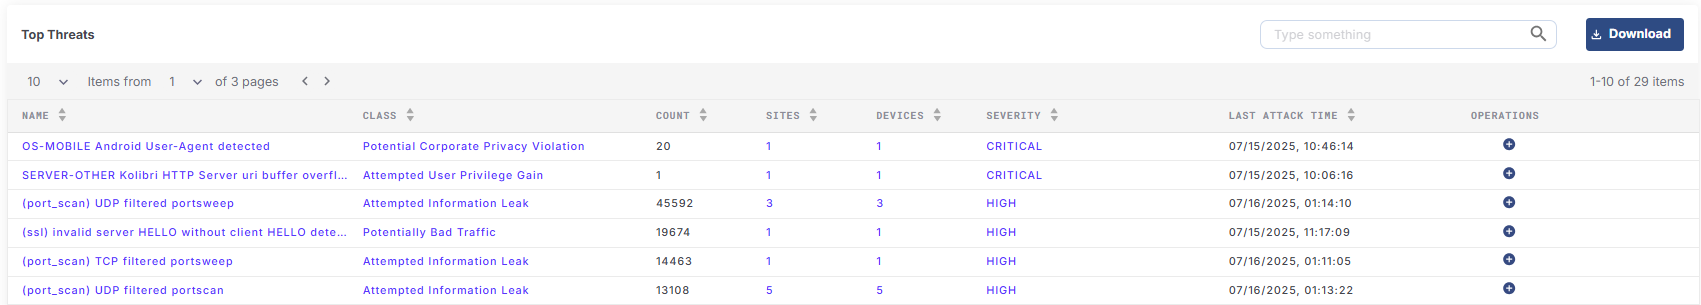
Click the dropdown given below the Top Threats heading to change the number of items displayed in one page. The pagination helps the user navigate to the next page by using the < > buttons or click the dropdown menu to move to the intended page.
Click Download to download the table data in CSV format.
All Threats
The All Threats section shows the complete log of all threat alerts received by the system. The Table shows the following information:
Site Name
Device Name
Class - Class of the Threat.
Severity - Severity level of the Threat.
Action - The type of action taken by the system (Allow/Block)
DST IP
SRC IP
Interface
Attack Time
Metadata

All Threats