
SDWAN
This manual guides the user through the steps required to use the SDWAN screen in Kognitive Cloud. The SDWAN screen can be accessed after selecting an individual site. It enables the user to view the key metrics of the different WAN interfaces associated with the devices in the site. Each device deployed in the site has different WAN interfaces depending upon their type. These WAN interfaces have different key metrics to measure their performance.
Click the SDWAN tab.
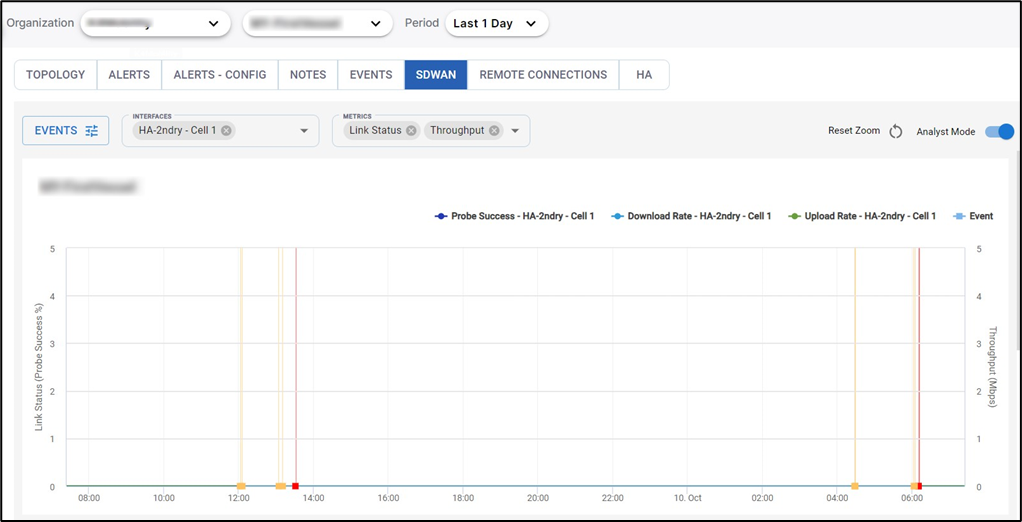
SDWAN
Select the Period from the dropdown menu. The available options are Last 15 min, Last 1 Hr, Last 6 Hr, Last 12 Hr, Last 1 Day, Last 7 Days and Last 30 Days.
The user can also select a custom time interval using the From and To fields.
Click the Interfaces field to open the dropdown menu. In this dropdown, the WAN interfaces associated with all the devices deployed in the site will be listed.
Select the required WAN interface.
In the Metrics field, select the required metrics from the dropdown menu. The Key Metrics available for different WAN interfaces are as follows:
LBAND: Link Status, Peak Rate Estimate, Latency and Jitter, Throughput
Cellular: Link Status, Peak Rate Estimate, Latency and Jitter, Throughput, SINR, RSSI
Starlink: Link Status, Peak Rate Estimate, Latency And Jitter, Throughput,
VSAT: Link Status, Peak Rate Estimate, Latency and Jitter, Throughput, VSAT SNR, VSAT TX Power, VSAT Power, VSAT Symbol Rate
Wi-fi: Link Status, Peak Rate Estimate, Latency and Jitter, Throughput
Wired / IOT: Link Status, Peak Rate Estimate, Latency and Jitter, Throughput, Roll, Pitch, Yaw, Temperature, Angular Velocity - X, Angular Velocity - Y, Angular Velocity – Z.
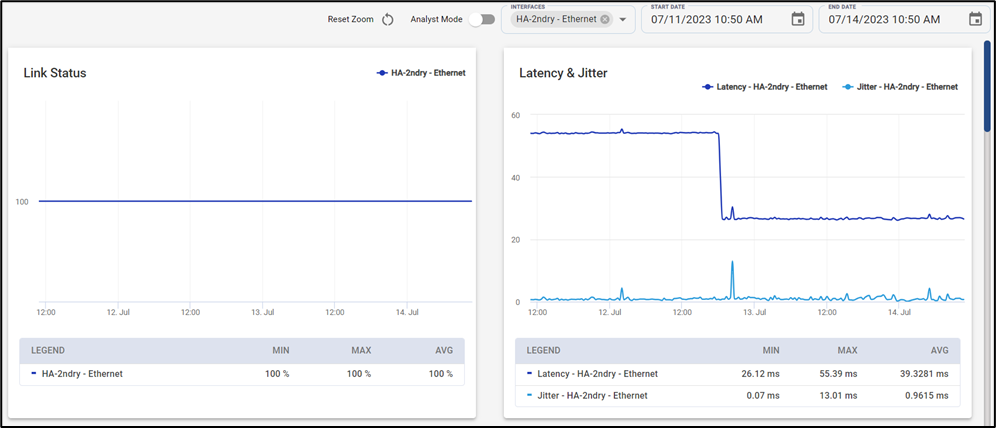
The performance of the device based on the selected metrics is shown in the format of a chart. The horizontal axis contains the time instances, and the vertical axis contains the metric values in their corresponding SI unit.
The graph between these two axes gives the user a clear understanding of how the device has performed during the selected time interval.
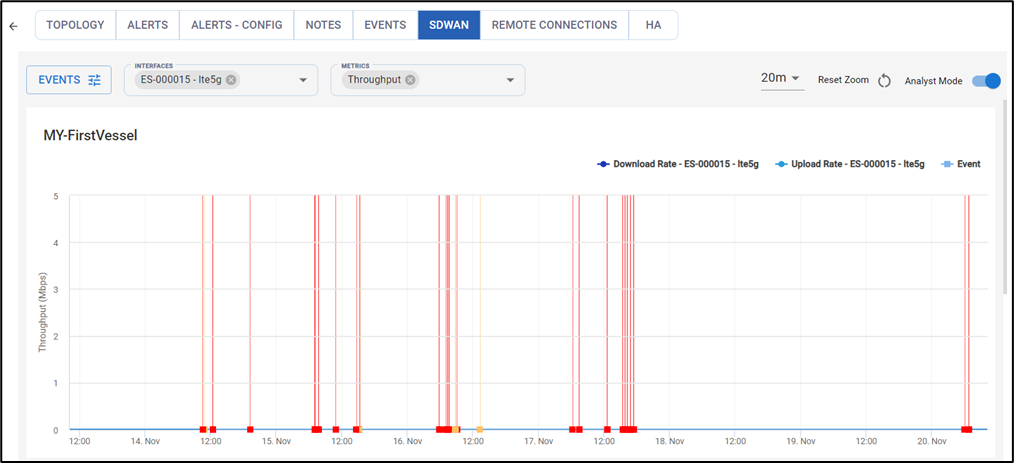
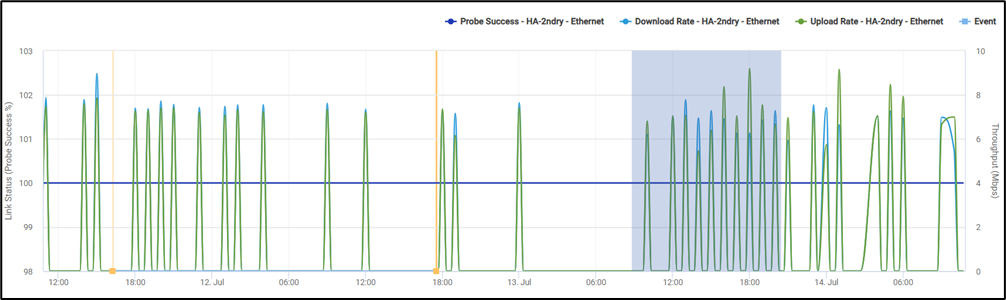
Throughput Chart
The user can select multiple WAN interfaces at the same time and compare their performances.
The user can also select multiple Metrics at the same time and view their values.
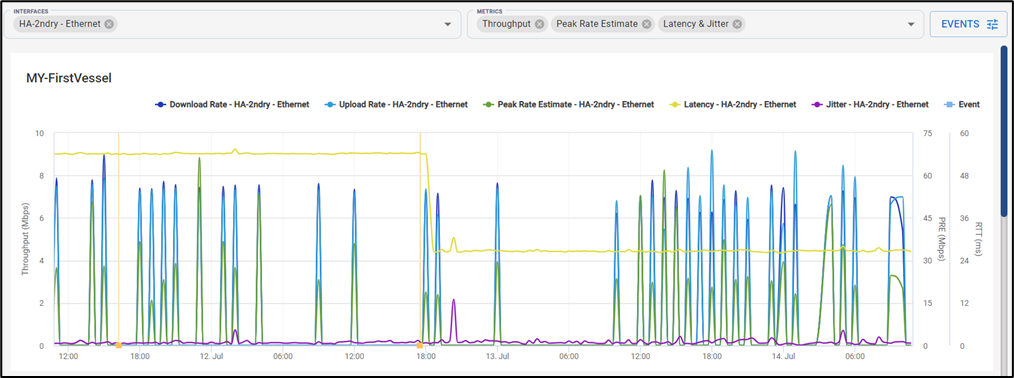
Multiple Metrics
The Legend provided below the Chart helps the user to differentiate between the various types of metric values plotted in the chart. It also shows the Minimum value, Maximum value, and Average value of the selected metric.
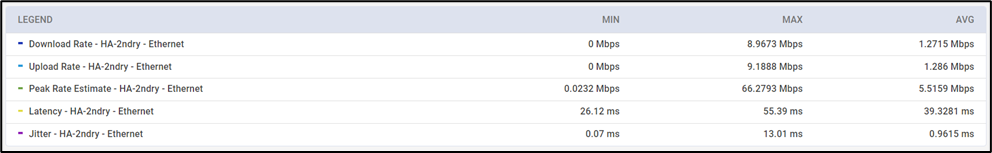
Legend
Hover the cursor at any point on the chart to view the value of the metric at that time instance.
Events
Along with the metrics, the chart also plots the Events happening in the WAN interfaces.
The square points marked on the chart denote the events. Hover the cursor on the square point to view the details of the event.
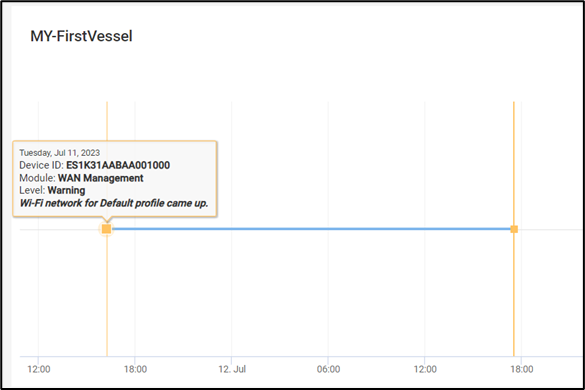
Events
Click the Events button to select the type of events that will be plotted in the Charts.
Select the checkboxes of the devices for which the user wants to record the events.
Select the checkboxes of the Modules for which the user wants to record the events.
Select the checkboxes of the Levels for which the user wants to record the events.
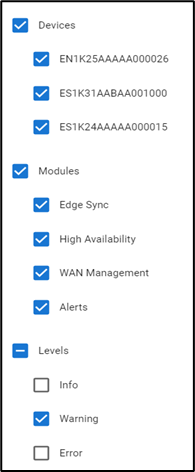
Events Filter
The Events table also lists all the events that are happening in the WAN interfaces. It shows information such as:
Timestamp – Date and Time of the event
Device S/N- Serial Number of the device
Level – Level of warning
Module – Module in which the event has occurred
Description – Description of the event
Metadata
When there are many events to be listed in the table, the pagination helps the user navigate to each page by using the < > buttons.
Click the dropdown menu given at the bottom of the table to choose the number of events to be seen in a single page. The user can choose between 5/10/15/20/25/50/100 from the dropdown menu.
Disable Analyst Mode
By default, the Analyst Mode will be switched on. The Analyst Mode displays all the charts in the same screen.
Click the Analyst Mode toggle button to disable the Analyst Mode.
Now, all the charts will be shown individually.
Disable Analyst Mode
Zoom and Rest Zoom
The charts have pinch and zoom functionality. Click anywhere on the chart and drag the cursor to select a specific area.
Pinch & Zoom
Release the cursor. The selected area will be zoomed in.
Click Reset Zoom button to reset the zoom and return to full chart.