
Dashboard - Starlink
This manual guides the user through the steps required to set up and use the Dashboard tab in Starlink Cloud. Starlink Cloud enables the user to view the amount of data consumed by the users through their Starlink user terminals, the plans of the Starlink service lines, current billing usage, Starlink User Terminal information, set quota for the service lines, view the insights and more. Users can view the amount of data consumed through their Starlink User Terminals between arbitrary time intervals. The data usage information obtained from the Starlink screen can be used for further analysis and to make informed business decisions.
The users that use an Edge device in tandem with their Starlink device can see data from their User Terminals in the Dashboard screen automatically.
The users that do not have an Edge device will have to subscribe to the Starlink Subscription model to view data from their User Terminals. Please refer Starlink Subscription section in the Service Line page for more details on enabling subscription on the Service Lines.
Any changes made to account or configuration information on Starlink may take up to 30 minutes to reflect in the Kognitive Cloud Portal.
Login to the Kognitive Cloud using valid credentials.
Select the Starlink option from the left menu bar.
The Starlink screen opens as shown in the below figure.
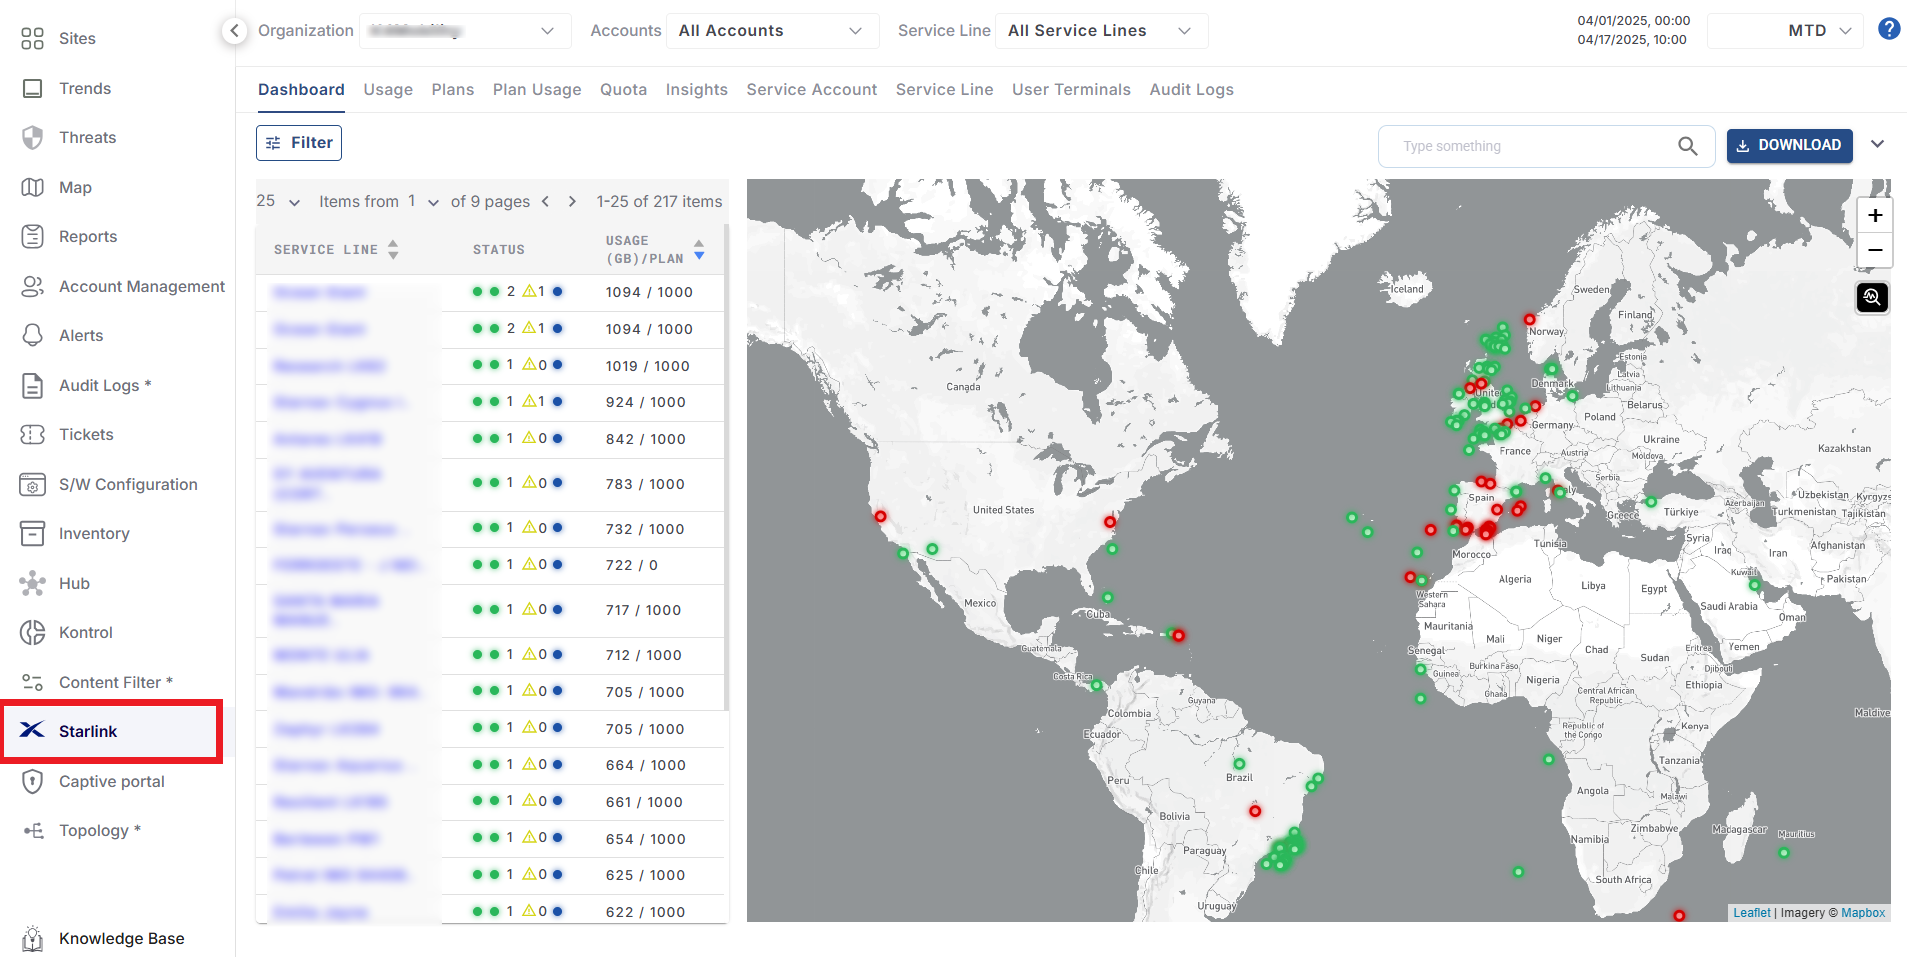
Starlink Screen
In the Organization field, select the organization or sub-organization from the dropdown menu. By default, the organization associated with the logged-in admin's email ID is pre-selected. The dropdown list consists of all the sub-organizations under the logged in admin organization.
In the Accounts field, select the service accounts from the dropdown menu. If an organization has multiple service accounts linked with it, they will all be listed in the dropdown menu.
Select the Service Line from the dropdown menu. All the service lines that the logged in user has access to will be available to select in the dropdown menu. This list is not based on the Organization or Sub Organization. It is entirely based on the Service Lines selected to be accessible for the user during creation of the user account in the Account Management screen. Select All Service Lines to view all the service lines available for the user.
The Starlink screen consists of 9 tabs:
Dashboard
Usage
Plans
Plan Usage
Quota
Insights
Service Account
Service Line
User Terminals
Audit Logs
The Dashboard tab is selected by default.
The Dashboard tab enables users to view the list of Starlink service lines associated with the selected organization, see their locations on a world map, monitor internet connectivity status, track data usage against the total quota, and access additional relevant information.
Select the Filter button to filter the Service lines based on Online/Offline Service lines, Online/Offline Terminals, No Terminals, Mobile Priority Enabled/Disabled and Alerting Terminals. Select the required filters and click Apply Filters button. The table will update to display the corresponding results.
The table shows the list of Starlink Service Lines associated with the selected organization. The table also shows the following information:
Service Line - Name of the Service Line
Status - Shows the number of User terminals under the service lines and their Internet connectivity status
Usage / Plan - The amount of data consumed by the service line through their Starlink User Terminals in GB and the total data allocated in the plan
-20250417-104248.png?inst-v=e0cf5ebf-01b8-481c-aa14-2a58f83bb340)
Service Lines Table
Click the name of any service line in the table to view its location on the world map in the right panel.
-20250417-105327.png?inst-v=e0cf5ebf-01b8-481c-aa14-2a58f83bb340)
Service Line Details
The popup box in the map shows the following information:
Organization and Sub Organization Names
Date and Time
Service Line Name
Service Line Number
Plan associated with the Service Line
Usage - The total data usage and the breakdown of Priority, Opt-In and Standard data usage
KIT Number selection field - If multiple user terminals are available
Terminal ID
Obstruction percentage faced by the User Terminals
Speeds of Downlink and Uplink Throughput in Mbps
Signal Quality Percentage
Ping Drop Rate in the User Terminals in percentage
Ping Latency in the User Terminals
Uptime
Last Online Date and Time
Coordinates
Click the Site button to open the Topology screen of the selected site.
Click the Insights button to open the Starlink - Insights screen of the selected site.
Select the
icon to perform the following Service Line actions. The Operations pop up box opens.
-20250417-110827.png?inst-v=e0cf5ebf-01b8-481c-aa14-2a58f83bb340)
Operations
Service Line Details
The Service Line Details option is selected by default in the side menu bar.
The right panel shows the Account Number of the selected service line, Service Line Number, Service Line Name, Home Address and Kit Serial Number.
Select the Site from the dropdown menu to assign the service line to it.
Select the Device.
Enter the Email Ids.
Change Sub Organization
Select the Change Sub Organization option from the side menu bar to change the sub organization of the Service Line.
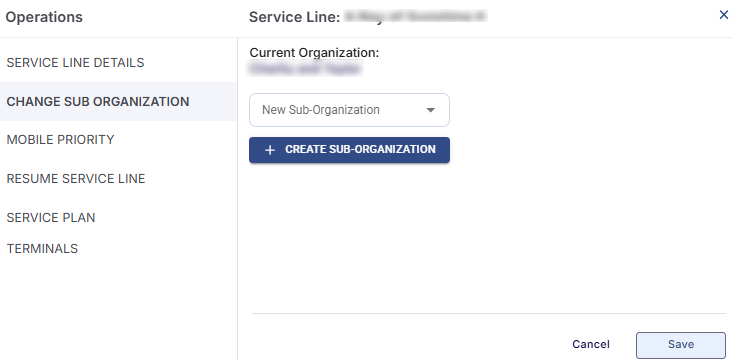
Change Sub Organization
The Current Organization of the service line is shown.
Select the New Sub-Organization from the dropdown menu.
If the user wants to create a new Sub-Organization, select the Create Sub-Organization button.
Select the Parent Organization from the dropdown menu.
Enter the new Sub-Organization name.
Click Create button. The new Sub-Organization will be created.
In the Sub-Organization field, select the required Sub-Organization.
Click Save to change the Sub-Organization.
Adding a Starlink User
After creating a new Sub-Organization, the user might want to add user accounts to that Sub-Organization. To add a new Starlink user account, follow the below steps:
Select Account Management option from the left menu bar.
The Account Management screen opens as shown in the below figure.
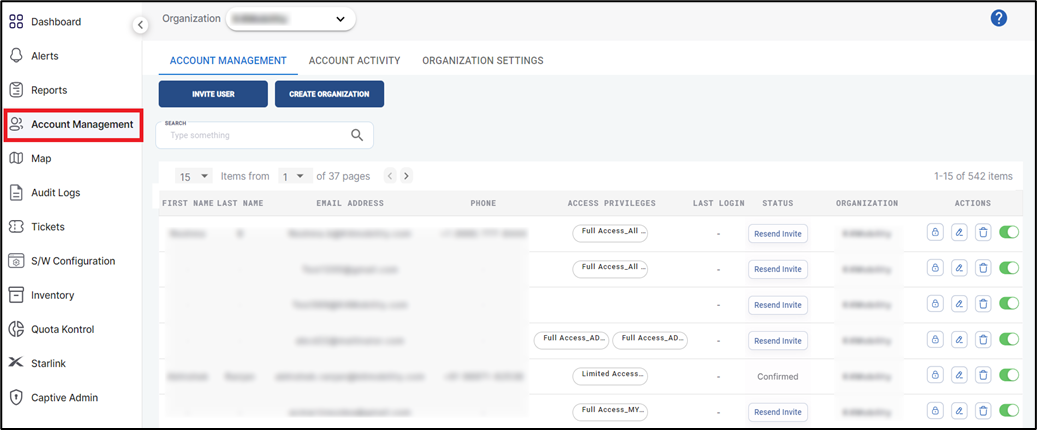
Account Management
Click Invite User button to create a new user account and invite them.
The Invite User dialog box opens.
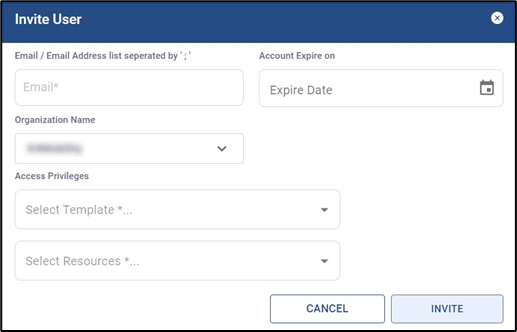
Invite User
Enter the Email Address. The admin can enter up to 30 Email IDs and create multiple accounts at once. The Email IDs should be separated by “;”.
Select the Expire date from the date picker. This is an optional field.
In the Organization Name field, select the required organization from the dropdown menu. If the Email ID of the user belongs to a new account, the selected organization becomes their Primary organization.
In the Select Template field, select the type of privilege that the user requires. The types of Access Privilege that can be selected for Starlink users are Starlink Access and Starlink Admin Access.
If the Admin selects Starlink Access, the user will be able to access only the Dashboard and Usage tabs of the Stralink screen. They will not be allowed to access the Admin tab and its operations.
If the Admin selects Starlink Admin Access, the user can access the Dashboard, Usage and Admin tabs of the Starlink screen. They can perform the Starlink Admin operations also.
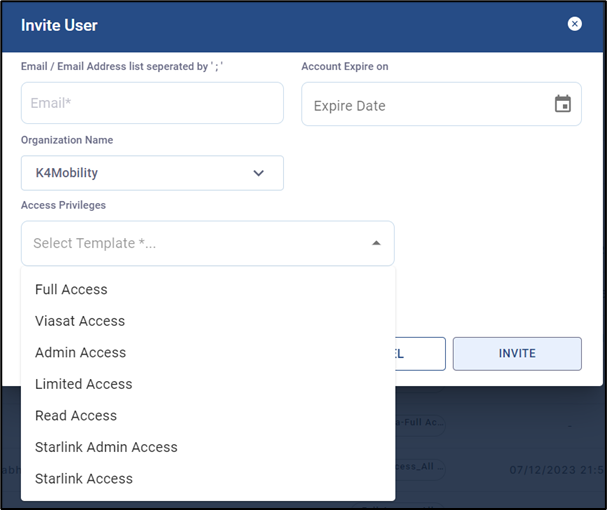
Starlink Access Privileges
Note: The users that are given access only for Starlink operations cannot access the other options in Kognitive Cloud such as Dashboard, Alerts, Reports, Account Management, Map, Audit Logs, Tickets, S/W Configuration, Inventory, Quota Kontrol and Captive Admin. The user account needs Full Access Privilege to access these features.
In the Select Resources field, select the sites that the user needs access to from the drop down menu. Select All Sites to give the user access to all the sites under the selected organization.
Click Invite button to send the account registration invite to the user.
The user will receive the following registration invite email from Accounts.
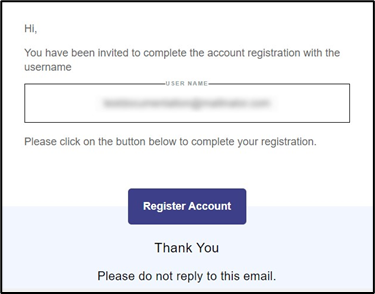
Register Account Email
Click on Register Account button at the bottom of the email body. The user is directed to the Account Registration Page.
Enter the required details in the form.
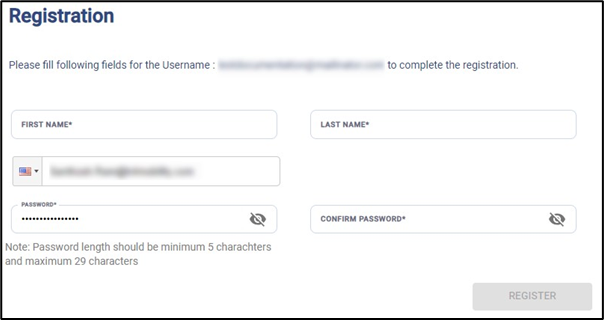
Registration Page
Click Register button.
The account will be activated successfully. The user can now access the Starlink screen in the Kognitive Cloud.
Mobile Priority
The user can activate Mobile Priority feature on the Starlink Service Plan of their User terminals by using the Mobile Priority option in the side menu bar.
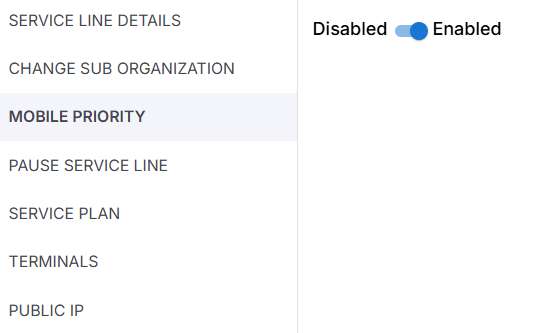
Mobile Priority
The Mobile Priority feature enables the user to experience high speed internet even when their sites are mobile or in transit.
To activate Mobile Priority, the Service Line must be subscribed to Starlink Subscription and it should have an active Starlink Service Plan.
Click the
toggle button to activate Mobile Priority feature for the corresponding service line.
After the user clicks the Enabled toggle button, the below dialog box will be displayed and Mobile Priority will begin within 15 minutes.
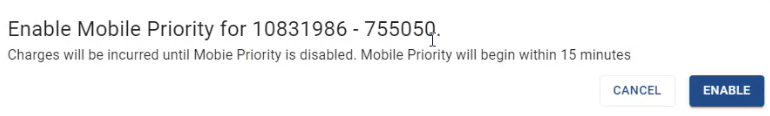
The user can Opt-out of the Mobile Priority feature by clicking the Disabling the toggle button.
Pause/Resume Service Line
The user can Pause/Resume their Starlink Service Plan on their User terminals by using the Pause/Resume Service Line option in the side menu bar.
Click the Pause Service Line option.
After clicking the Pause Service Line option, the user has to choose when to end the Service Plan. They can choose to end it immediately or on the Billing Date. Choose the required option from the dropdown menu.
-20240509-115216.png?inst-v=e0cf5ebf-01b8-481c-aa14-2a58f83bb340)
Pause Service Line
Similarly, the user can also Resume their Starlink Service Plan on their User terminals that were paused previously.
Click the Resume Service Line option in the side menu bar.
After clicking the Resume Service Line option icon, the user has to select the required Service Plan from the dropdown menu in the Select Products field.
-20240509-122722.png?inst-v=e0cf5ebf-01b8-481c-aa14-2a58f83bb340)
Resume Service Line
Click Resume to resume the Starlink Service Plan on their User terminal.
Service Plan
Select the Service Plan option from the side menu bar to view or change the service plan linked with the service line.
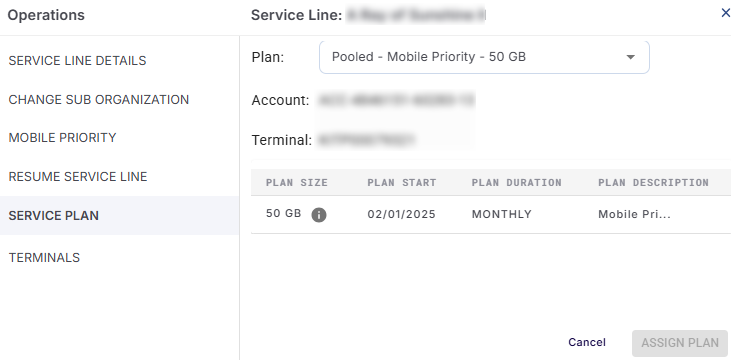
Service Plan
The current service plan linked with the service line is shown in the Plan field.
To change the service plan, select the required plan in the Plan field. The dropdown menu shows all the custom plans created by the user and also the standard plans provided by Starlink.
Select the Assign button to save the changes.
Please note that when a service plan is changed to one with a higher Plan Size, the change is reflected in the system immediately. But, when a service plan is changed to one with a lesser Plan Size, the change is reflected in the system only at the start of the next billing cycle.
The Account Number and Terminal Number of the service line is also shown.
The table shows the following information:
Plan Size - Data quota of the current service plan.
Plan Start - Start date of the current plan
Plan Duration - Duration of the current plan
Plan Description - The description of the current plan
Terminals
Select the Terminals option from the side menu bar to view the Associated Terminals and also add more terminals to the service line.
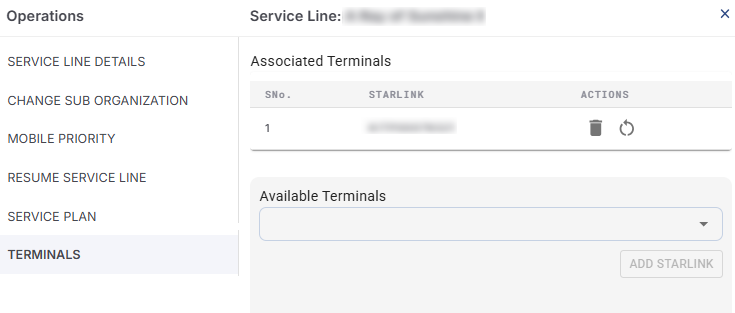
Terminals
The Associated Terminals are shown in the right panel.
Click the Delete
icon to delete the terminal.
Click the Reboot
icon to reboot the terminal.
Under the Available Terminals field, select any terminal from the dropdown menu.
Select the Add Starlink button to add the terminals to the corresponding Service Line.
Public IP
Select the Public IP option from the side menu bar to toggle the IP from Default to Public or vice-versa.