
Sessions
By default, the Captive Access Network Homepage displays the Sessions tab.
-20250516-111100.png?inst-v=360eba69-b4e7-4616-8c2d-65aa1289b23b)
Sessions
Search Hierarchy
Select the dropdown menu at the top right corner of the screen to select the required Organization or sub-organization. The logged in admin organization is populated by default here. This is the organization corresponding to the email ID used to login.
The dropdown list consists of all the sub-organizations under the logged in admin organization.
The admin can search for a specific organization by clicking the dropdown menu and typing the required keyword in the search bar.
Click the Hierarchy
 icon to enable / disable Hierarchy Search feature.
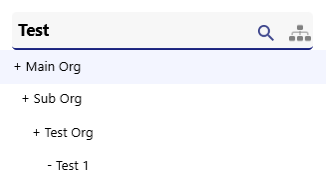
When Hierarchy search is disabled, the search results show only the Organizations and Sub organization that match with the keyword and their parent organizations.
Refer the below image. Only the organizations that match with the test keyword are shown in search result and their parent organizations.
Hierarchy search disabled
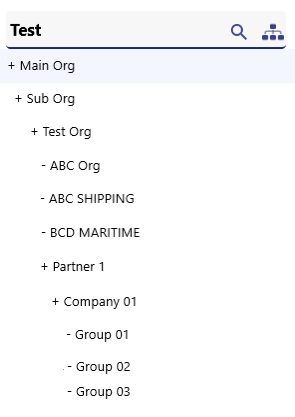
When Hierarchy search is enabled, the search results show the organizations that match with the keyword and all the sub organizations that are under the matched organization in hierarchical manner.
Refer the below image. The Organization that matches with the “Test” keyword is shown along with all the sub organizations that are created under it.
Hierarchy search enabled
Select the required sites from the second dropdown menu.
The number of Logged In Users, the number of Active Sessions, the number of Active Sites and the Total Data Usage at that instant is shown at the top right corner of the screen.
Sessions table
Select the Last 24 hours radio button to view the session details of users logged in the past 24 hours.
Select the Custom Search radio button to view the session details between a specific time period.
Select the Start Date and Time. Select the End Date and Time.
Click Apply button.
The table shows the session details of users logged in during the selected time period.
It shows the below information:
Site Name – Name of the site.
Organization – Name of the organization.
Username – Username of the user.
Currently Logged In – Indicates whether the user is currently logged in or not.
‘Y’ – If user is logged in.
‘N’ – If user is logged out.
Plan / Traffic Policy – Plan and Traffic Policy of the user.
IP Address – IP Address of the user.
MAC Address – MAC Address of the user.
Host Name – Name of the Host system.
Device Type - Type of the Device.
Last Activity – Date and time of last activity by the user.
Start Time – Start date and start time of the session.
End Time (Duration) – End date and end time of the session. The time duration of the session is also shown.
Quota Used – Amount of data used in the session.
Logout Cause – Reason for logout of the session. The types of logout causes are as follows:
User Action
Daily Quota Limit Exhausted
Daily Time Limit Exhausted
Inactivity Timer
Plan Quota Exhausted
Max Device Limit Reached
Plan Expiry (Note: The table does not show expired plan session. So, the user will not receive this cause as API response)
The Username column and Plan/Traffic Policy details is clickable. Clicking a Username filters the entire screen and displays the details corresponding only to that user.
The Plan/Traffic Policy column is also clickable. Clicking a Plan/Traffic Policy filters the entire screen and displays the details of that Plan.
The Search field can be used to search for the device based on the Site/Username/IP/MAC/Hostname/Logout Cause.
Click the Generate Session Report icon to generate the Session Report in CSV format.
Select the Start Date and Time.
Select the End Date and Time.
Click Confirm button.
The session report will be generated in CSV format. The generated reports will be available in the Reports tab.
The pagination helps the admin navigate to the next page by using the < > buttons.
Click the dropdown given next to the Pagination to change the number of sessions displayed in one page. The admin can choose between 10/25/50/100/150/200 from the dropdown menu.