
Map
The Map screen provides geographical data that corresponds to the physical location of each site. It enables the user to see all the sites and Starlink devices of the selected Organization. The Map screen also shows historical signal performance metrics (RSSI, etc.) for physical locations of sites within an organization.
Select the Map option from the left menu bar of Kognitive Cloud.
In the Organization field, select the Organization or sub-organization from the dropdown menu. The logged in admin Organization is populated by default here. This is the organization corresponding to the email ID used to login.
The dropdown list consists of all the sub-organizations under logged in admin organization.
In the Sites field, select the required sites from the dropdown menu. The dropdown menu consists of all the sites associated with the selected Organization and sub-organizations.
-20240524-101140.png?inst-v=ca31c0fd-73f9-4bed-9ee6-4837b932406f)
Map
The Sites are denoted by the blue arrow mark icon
 on the map.
The Starlink devices are denoted by the
 icon on the map.
Hover the cursor on the Sites to see the Name of the site.
Click any site to view more details about the site such as Name, Last Seen, Availability and Alert data.
The legend at the bottom left corner of the screen helps the user to differentiate between the Sites and the Starlink devices plotted on the map.
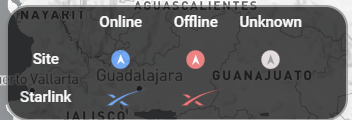
Map Legend
Click + icon on the right side of the screen to zoom in on the map.
Click - icon to zoom out.
Click at any location on the map and drag the cursor to pan.
Click the Layers icon
 to open the Map Layers pop up.
Map Layers
The Map Layers pop up opens as shown below:
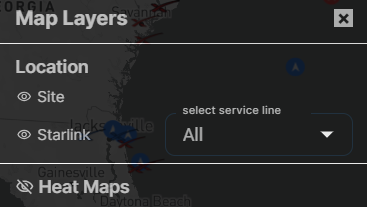
Map Layers
Click the
 eye icon to view/hide the Site locations plotted on the map.
Click the
 eye icon to view/hide the Starlink device locations plotted on the map.
The user can also select the required Starlink Service Lines from the dropdown menu and view only the selected sites on the map.
Heat Maps
Click the
 icon to open the Heat Maps section. The Heat Maps section enables the user to divided the entire map into several hexagonal layers and view their data parameters individually.
There are two types of Heat Maps - Macro & Micro.
The Macro layer is used to analyze a larger area. One Macro hexagon covers 12393 square km.
The Micro layer is used to analyze a smaller area. One Micro hexagon covers 1770 square km.
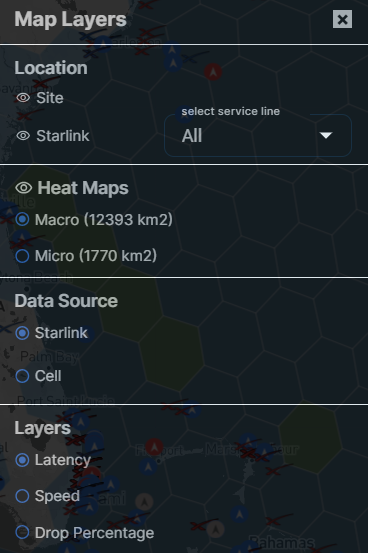
Heat Maps
Select the Heat Maps type (Macro/Micro).
Select the Data Source. The Data Source field enables the user to toggle between different Data Sources such as Starlink and Cell to view their performance metrics and analyze them.
Layers for Starlink
Select the Starlink option under the Data Source section.
The performance parameters available for Starlink are:
Latency
Speed
Drop Percentage
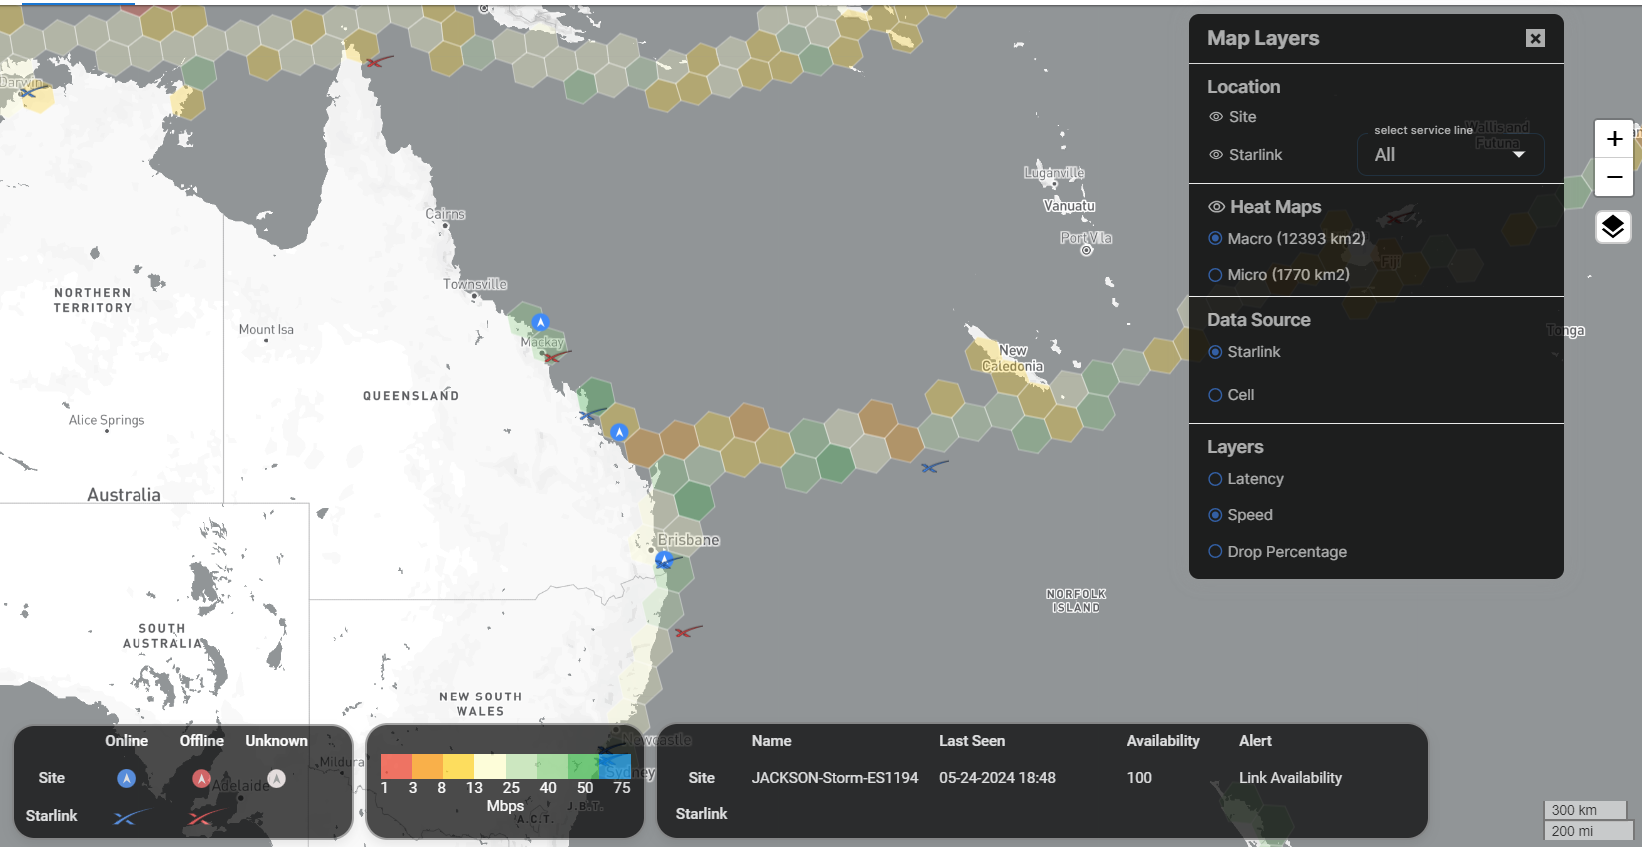
Latency
Select Latency.
The hex layers show the latency values at different areas of the map.
The value of Latency at any point can be known from the color of the corresponding hex layer.
-20240524-133742.png?inst-v=ca31c0fd-73f9-4bed-9ee6-4837b932406f)
Latency - Starlink
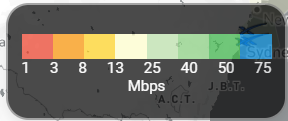
The legend at the bottom of the screen can be referred to understand the color codes of different Latency values.
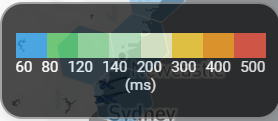
Latency - Legend
Speed
Select Speed from the Layers section.
The hex layers show the Internet Speed values at different areas of the map.
The value of Speed at any point can be known from the color of the corresponding hex layer.
Speed - Starlink
The legend at the bottom of the screen can be referred to understand the color codes of different Speed values.
Speed - Legend
Drop Percentage
Select Drop Percentage.
The hex layers show the Drop Percentage values at different areas of the map.
The value of Drop Percentage at any point can be known from the color of the corresponding hex layer.
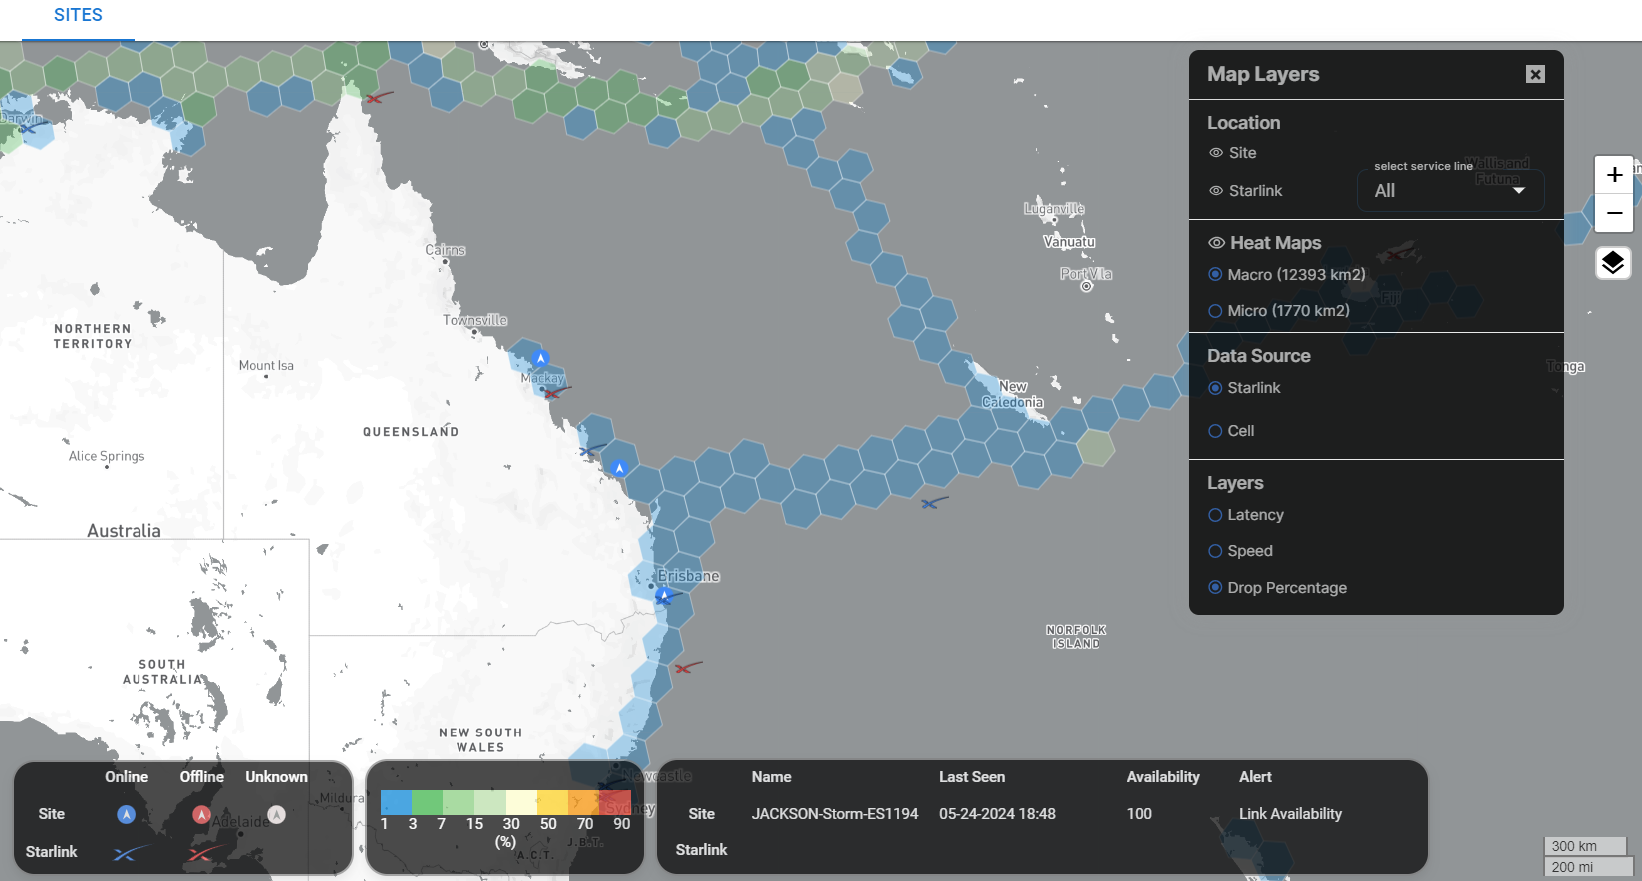
Drop Percentage - Starlink
The legend at the bottom of the screen can be referred to understand the color codes of different Latency values.
Drop Percentage - Legend
Click any Hex layer to view the performance parameters in the form of a bar chart.
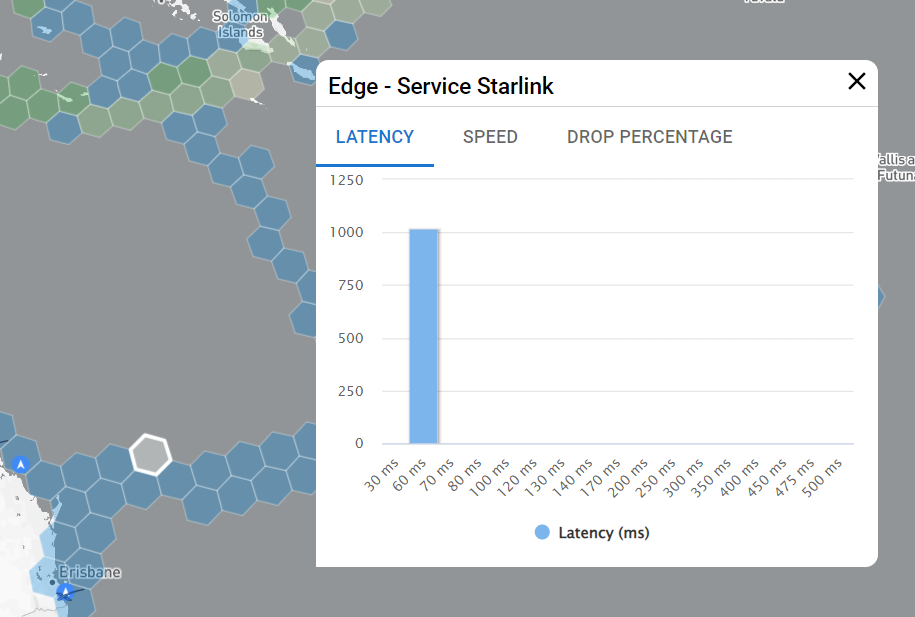
Bar Chart
Layers for Cell
Select the Cell option under the Data Source section.
If the user selects Cell, one more additional field will be available. Select the required Provider from the dropdown menu. Now the map will be filtered and only the hex layers where the selected provider is available will be shown to the user.
The performance parameters available for Cell are:
Call Performance
Fastest Speed
Call Performance
Select Call Performance.
The hex layers show the Drop Percentage values at different areas of the map.
The value of Drop Percentage at any point can be known from the color of the corresponding hex layer.
The RSSI value is taken as metric to measure the Call Performance.
The legend on the bottom of the screen shows the different color codes and their corresponding RSSI value.
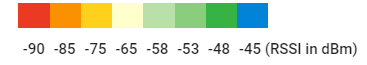
RSSI Legend
The Hex Layers are colored as per the RSSI value existing in that particular area of the map. This helps the user to understand the Call Performance at that area.
Fastest Speed
Select Fastest Speed.
The hex layers show the Fastest Speed values at different areas of the map.
The value of Fastest Speed at any point can be known from the color of the corresponding hex layer.
The Mbps (Megabyte per second) value is taken as metric to measure the speed of internet connectivity.
The legend on the bottom of the screen shows the different color codes and their corresponding Mbps value.
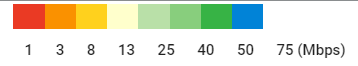
Mbps Legend
The Hex Layers are colored as per the Mbps value existing in that particular area of the map. This helps the user to understand the speed of internet connectivity at that area.