IPS Configuration
A Network Intrusion Prevention System (IPS) is designed to monitor and secure network traffic by identifying and stopping potential threats. It inspects data packets in real-time, using predefined rules to detect suspicious activities, such as malware or unauthorized access. When a threat is detected, the system immediately blocks or mitigates the malicious traffic and logs the event for further analysis. This ensures the network remains secure and resilient against attacks while also enabling data to be analyzed for pattern recognition and continuous improvement.
Key Functions of Kognitive IPS:
Detection: Monitors incoming and outgoing traffic for suspicious patterns or signatures that match known attack types (like malware, vulnerabilities, or exploits). These Signatures are updated frequently to ensure that the IPS defends against the latest threats.
Prevention: Once a threat is detected, the IPS can take action such as:
Blocking harmful traffic
Resetting connections
Sending alerts to administrators
Logging and Reporting: It logs details about the intrusion attempts for future analysis and creates reports for network administrators to review.
Benefits of Kognitive IPS:
Value Proposition
Kognitive IPS Platform incorporates the cutting-edge TALOS IPS rulesets [TALOS Intelligence] for monitoring and securing network traffic. Many IPS solutions use community or static IPS rule sets that are not regularly updated, leaving new and modern threats unaddressed and potentially leading to serious security breaches.
Kognitive IPS uses TALOS rulesets that are updated continuously (in most cases daily) and provide market leading threat defenses to protect your most vital assets. The Kognitive IPS Platform is highly configurable, providing the operator with the ability to adopt aggressive IPS defenses and determine which interfaces require this level of protection. Furthermore, all events are streamed to the Kognitive Cloud platform's Threat Dashboard, allowing for enhanced visibility and analysis of site and network threats.
Key benefits users gain from using Kognitive IPS include:
Real-time protection: Prevents threats before they cause damage.
Automated response: Reduces the need for human intervention during an attack.
Enhanced network security: Complements firewalls and antivirus solutions by providing more sophisticated threat detection.
The following sections outline the steps for configuring the IPS.
Configuration
Login to the Edge Portal with valid credentials.
Click the
 icon from the Edge Portal homepage.
Select Configuration Wizard from the options shown.

Menu
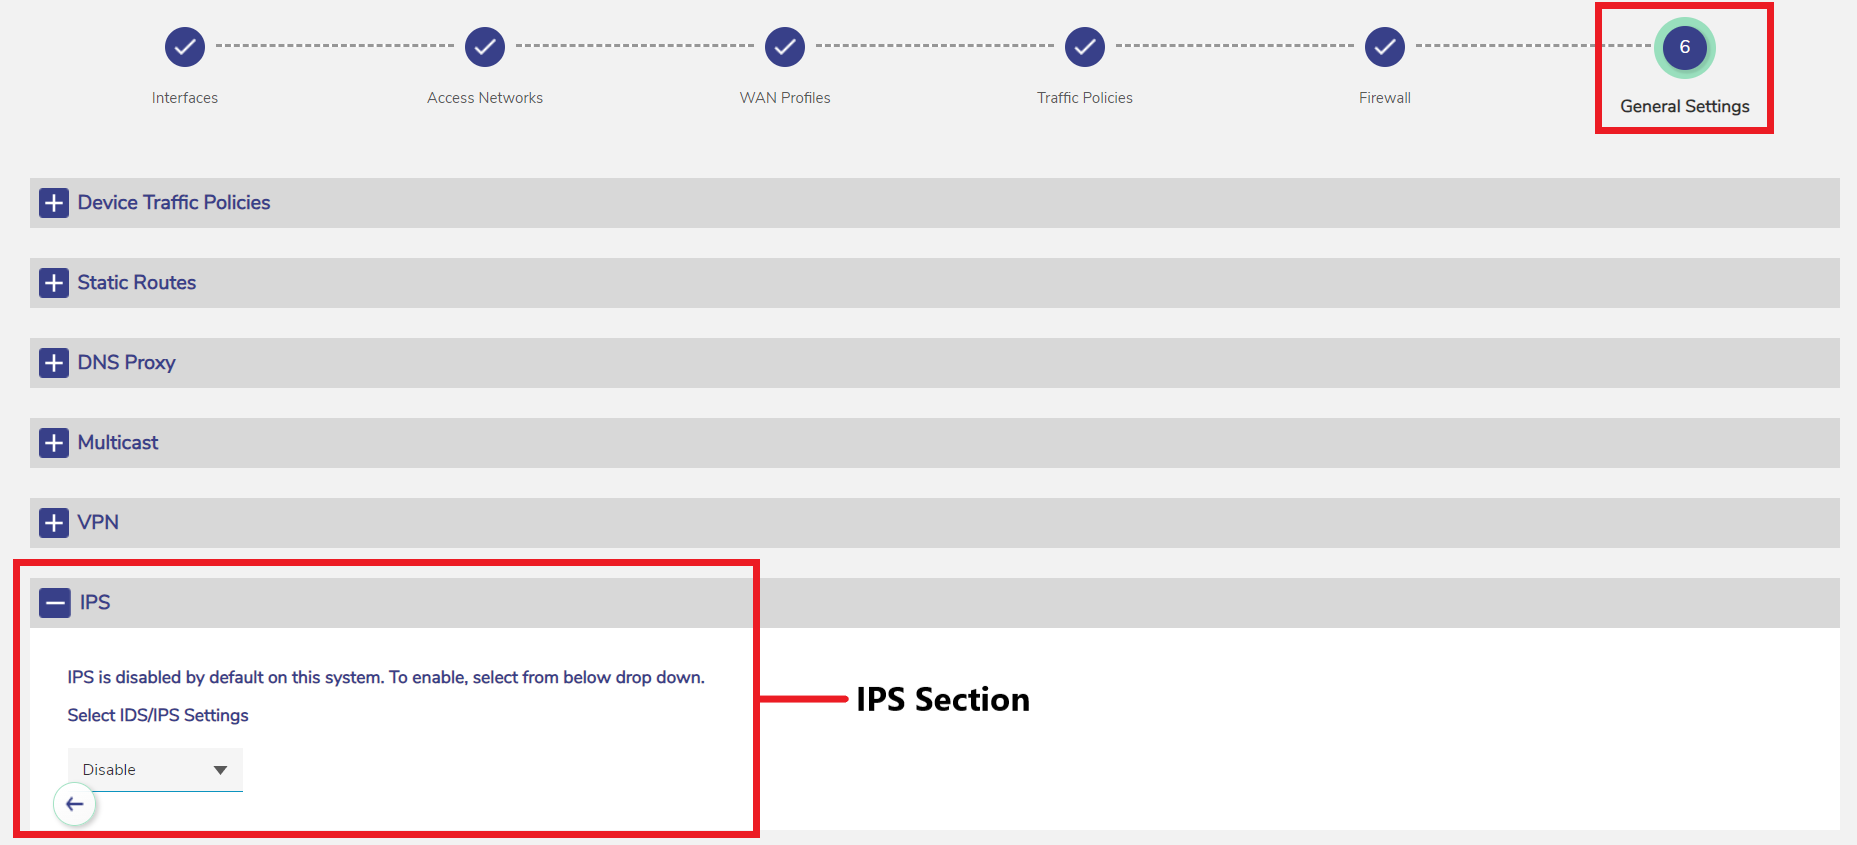
In the Configuration Wizard, select General Settings.
Select the IPS section to expand it.
The IPS section is visible only to the users with Edge Secure Enterprise or Hub Secure Enterprise license types.
This is not for the user level privilege. To use the IPS functionality, the device should be registered with any one of the above mentioned licenses.

IPS Section
IPS is disabled by default in the system. Select Enable in the Select IDS/IPS Settings dropdown menu to enable the IPS feature.
Once the user selects Enable, two more sections - IPS Configuration & Logs become available to the user. These sections are used to configure the IPS and to view the Logs of IPS alerts.

IPS Configuration Section
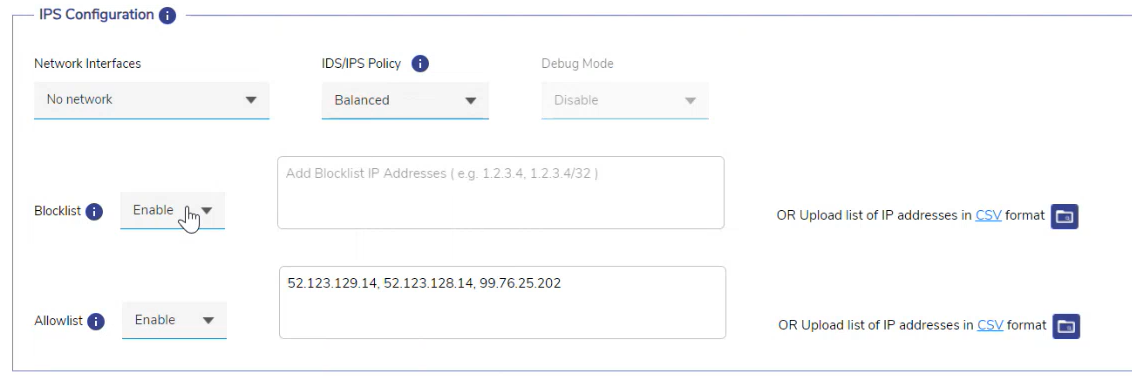
Select the Network Interfaces that need to be monitored from the dropdown menu. The dropdown shows all the WAN Interfaces and Access Networks configured in the system.
Please note that enabling IPS on more than one interface will use up more memory and CPU. Hence our recommendation is NOT to enable more than 2 interfaces or similar.
Select the IDS/IPS Policy from the dropdown menu. This will set the rules used by the IPS. The list of policies available in the system are:
IDS - None - Setting the policy to None makes the system an IDS (Intrusion Detection System). The user can use the system as an IDS when the IPS is getting false positives and blocking traffic that the user wants allowed. Typically the user can switch to IDS to determine which rules should be disabled without causing a service outage.
IPS:
Balanced - This policy is the default policy that is recommended for initial deployments. This policy attempts to balance security needs and performance characteristics. Users should be able to start with this policy and get a very good block rate with public evaluation tools, and relatively high performance rate with evaluation and testing tools. The recommended level is balanced, and if there are any issues switch to Connectivity.
Max Detect - This ruleset is meant to be used in testing environments and as such is not optimized for performance. Selecting Max-Detect has a very high probability of false positives, as it enables a very large ruleset. This may cause the IPS to interfere with network connectivity.
Connectivity - This policy is specifically designed to favor device performance over the security controls in the policy. It should allow the user to deploy their devices with minimal false positives and full rated performance of the box in most network deployments. In addition, this policy should detect the most common and most prevalent threats users experience.
Security - This policy is designed for the users that are exceptionally concerned about organizational security. Users deploy this policy in protected networks, that have a lower bandwidth requirements, but much higher security requirements. False positives, Noisy signatures, Application control, and locked down network usage are concerns to users deploying this policy. It should provide maximum protection, and application control, but should not bring the network down.
When the IDS/IPS Policy is selected as None, the user can enable the Debug Mode. This cannot be enabled if the user select any one of the IPS Policies.
Select Enable in the Blocklist field to activate the Blocklist functionality. Enter the Blocklist IP Addresses in the textbox. When Blocklist is enabled, traffic from these IP Addresses will be blocked regardless of the rule settings or Policy.
Guidelines for Blocklist - It is common to find public IP addresses or networks attempting to access your system that the IPS permits due to the current IPS policy level. To address this, the user can easily add those specific IP addresses or networks to the block list. An example of this would be an Internet IP that is probing your network, or an access network that is probing some vital system service - The user can simply block them using the Blocklist functionality.
Select Enable in the Allowlist field to activate the Allowlist functionality. Enter the Allowlist IP Addresses in the textbox. When Allowlist is enabled, traffic from these IP Addresses will be passed regardless of the rule settings or Policy.
Guidelines for Allowlist - A common use case for adding IP addresses or networks here is to allow an enterprise service that is frequently used but may trigger an IPS blocking event. A good example would be a file server or probe server used for network management. It's not uncommon for no IP addresses or networks to be added to this list.
The user can also upload these IP Addresses in bulk. Click the CSV button to download the sample format. Enter the IP details in the sample file and save it. Click
 icon and select the saved file to upload the IP Addresses.
The Allowlist feature takes precedence over the Blocklist feature.

Logs Section
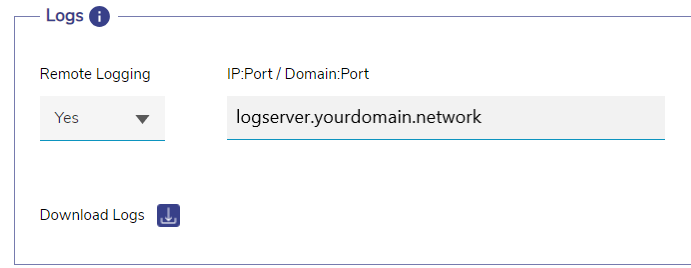
In the Remote Logging field, select Yes from the dropdown menu to enable Logging of IPS alerts.
Service messages and IPS Alerts are logged via standard syslog behavior. This log information may also be sent to a remote syslog/rsyslog host.
Enter the IP:Port / Domain:Port combination to send the log report.
Please note that the remote syslog/rsyslog must be enabled at the remote end and configured accordingly to log the inbound data. It is sent with local0 as the facility.
An example for the remote rsyslog configuration is given below:
$template RemoteLogs,"/var/log/%HOSTNAME%/%PROGRAMNAME%.log"
*.* ?RemoteLogs
& ~
# provides UDP syslog reception
module(load="imudp")
input(type="imudp" port="514")
# provides TCP syslog reception
module(load="imtcp")
input(type="imtcp" port="514")
Click the
 Download Logs icon to download the log reports locally.
Click Save button to save the changes.
