
Hub - Kognitive Cloud
This manual guides the user through the steps required to use the Hub screen in Kognitive Cloud. The Hub screen enables the user to view the list of Hub/Client Sites, their Organizations and Sub - Organizations, Data Usage and view other important details of the Hub devices.
Login to Kognitive Cloud using valid user credentials.
Kognitive Cloud Homepage
In the Organization field, select the Organization or sub-organization from the dropdown menu. The logged in admin Organization is populated by default here. This is the organization corresponding to the email ID used to login.
The dropdown list consists of all the sub-organizations under logged in admin organization.
Select Hub option from the left menu bar.
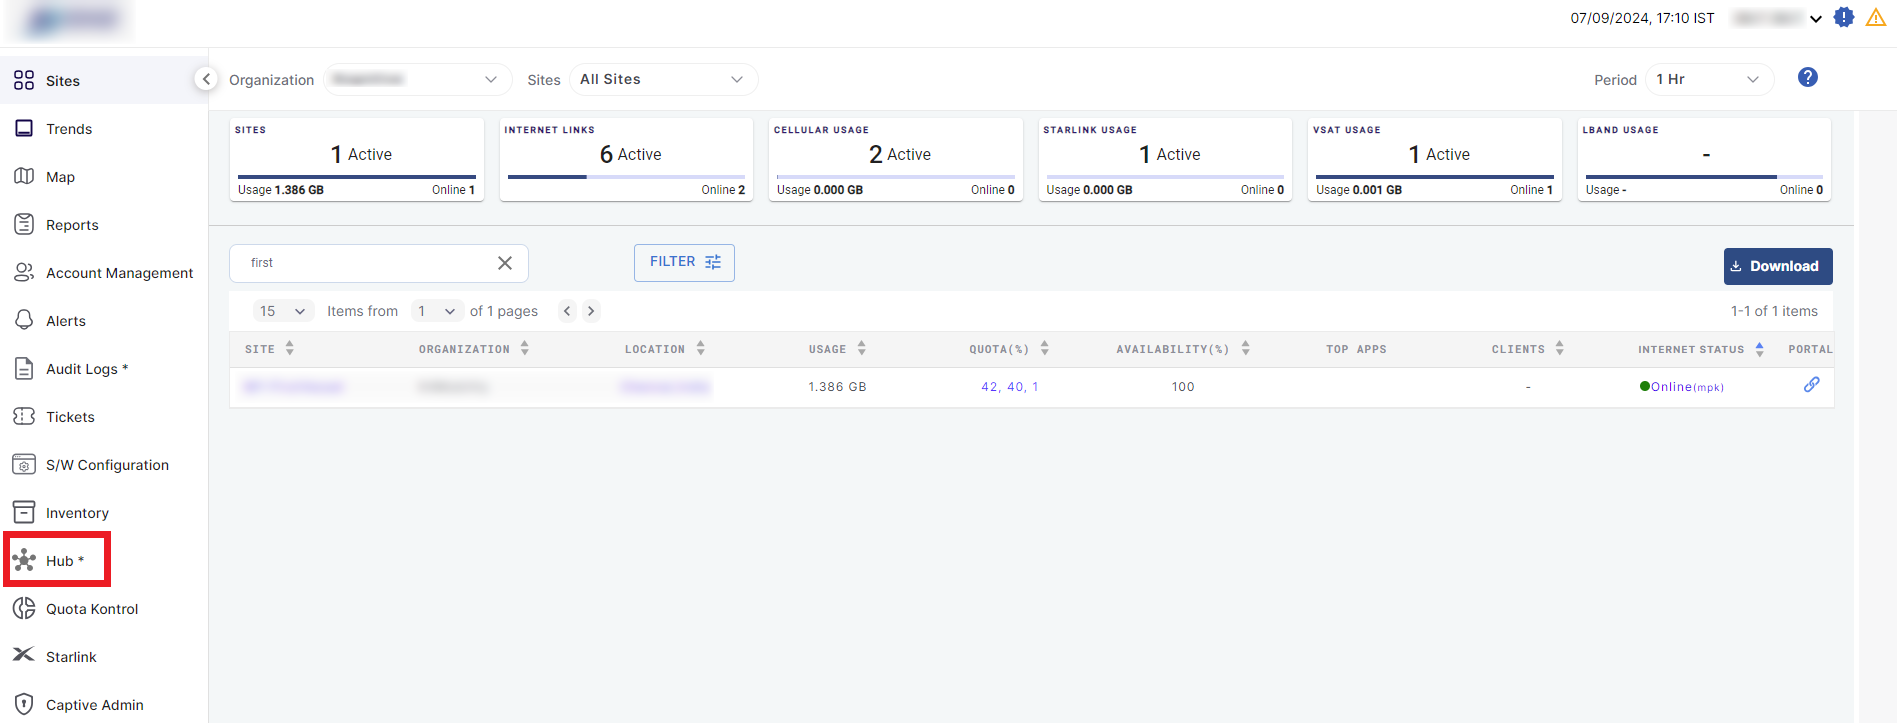
The Hub screen opens as shown in the below figure. The Hub Tab is selected by default.
-20250228-151238.png?inst-v=f7973c5e-4720-4374-88d5-68e50f2b6491)
Hub Screen
The table lists all the Devices/Agents associated with the selected Organization in its first row.
Click the
 Arrow icon to expand the Clients row. These are the Sites connected to the corresponding Hub.
The row expands to show all the Client devices linked with the Hub.
The table shows the following information:
Site - Name of the Hub/Name of the Client
Organization - Name of the Organization
Location - Location of the Site
Usage - Data consumed by the Site
Availability - In %
Throughput - In Mbps
Clients - Number of clients associated with the Site
Internet Status
MPK/VPN Status - Number of clients Online / Total Number of clients
Tunnels Connected - Number of tunnels connected
Portal - Link to connect to the Edge Portal
The Site names are clickable in this screen. Click the Site name to redirect to the Topology screen of the selected Site.
The Location names are also clickable in this screen. Click the Location name to redirect to the Map screen of the selected Site.
Note: When sites connect to a Hub, QUIC TLS-based encryption is used to secure the communication. Authentication is performed based on the profile configured.
Internet Status
Under the Internet Status column, click the
 icon to open the Internet Status Summary dialog box.
Using this feature, the user can view the Internet Status of the Interfaces and WAN profiles for the selected site.
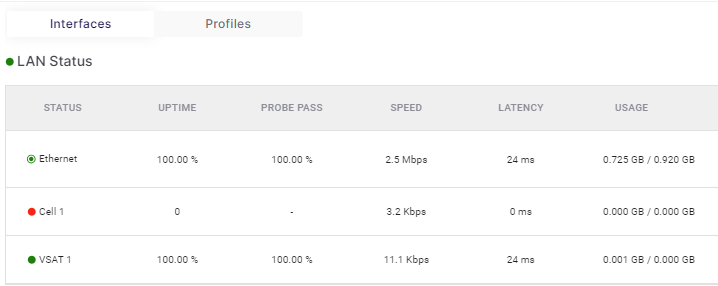
The dialog box opens as shown below:
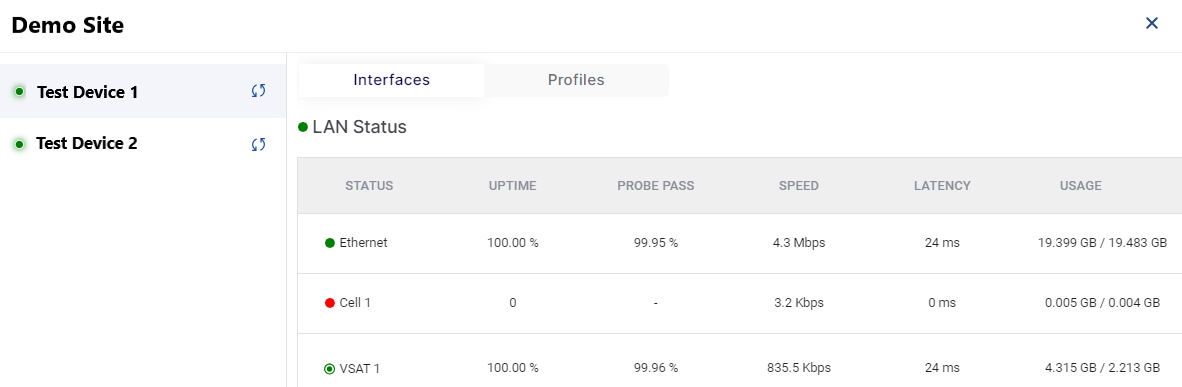
Internet Status Summary
On the left side of the dialog box, it shows the name of the selected site and lists all the devices deployed at the site.
Select the required device.
The right side of the dialog contains two tabs: Interfaces and Profiles.
Interfaces
By default, Interfaces tab is selected. This tab show the Internet Status summary of all the Interfaces configured in the selected device.
Interfaces
It shows the following information:
Status - The list of all interfaces configured in the selected device. The color coding shows the Internet Status of these interfaces.
 Active - WAN link/interface is enabled and passing traffic.
 Standby - WAN link/interface is enabled but is not actively passing traffic/data.
 Down - WAN link/interface is enabled but not connected or experiencing an outage.
 Disabled - WAN link/interface is disabled; traffic/data will not pass through this link/interface.
Uptime - Percentage of time that a link/interface is up.
Probe Pass - Percentage of successful probes in the given timeframe.
Speed - Internet speed or transfer rate, in Mbps.
Latency - RTT (Round Trip Time) it takes for a data packet to travel from the source to the destination and back again, in ms.
Usage - Total data consumed (download and upload), in GB.
Profiles
Click the Profiles tab to view the Internet Status summary of all the WAN Profiles configured in the selected device.
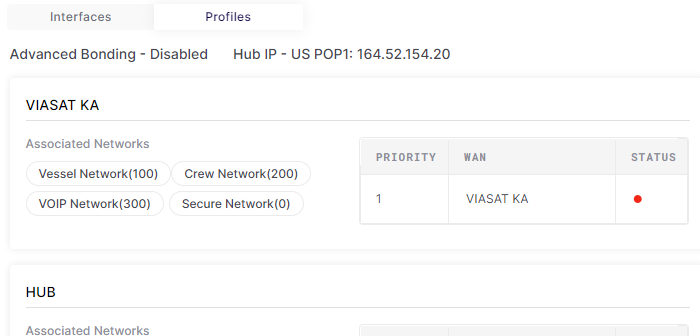
Profiles
The dialog box shows the following information:
The list of WAN Profiles configured in the system
The Access Networks associated with the WAN Profiles
The priority order of the WAN Links for each WAN Profile
The Internet Status of each of the WAN Links. The color coding for the internet status is the same as mentioned in the above section.
MPK / VPN Status
In the Hub row, the MPK / VPN Status column shows the Number of clients Online / Total Number of clients.
Under the Client row, it shows the Internet Status of the WAN Interfaces.
-20240719-144933.png?inst-v=f7973c5e-4720-4374-88d5-68e50f2b6491)
MPK/VPN
Click the
 icon of any Client device to open the WAN Interface dialog box.
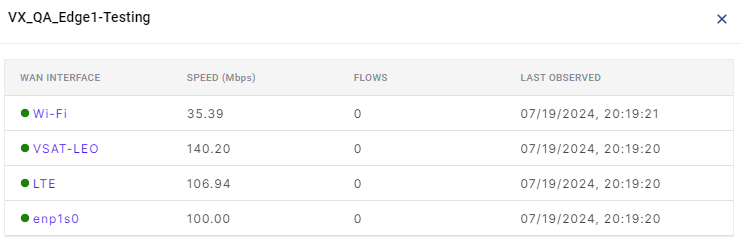
MPK/VPN Summary
It shows the following information:
WAN Interface - The color coding for the internet status is the same as mentioned in the above section.
Speed (Mbps)
Flows
Last Observed
The Interface names are clickable in this dialog box. Click the Interface name to redirect to the SDWAN screen. In the SDWAN screen, the Site, Interfaces and Metric will be auto-populated according to the selection in the MPK/VPN dialog box.
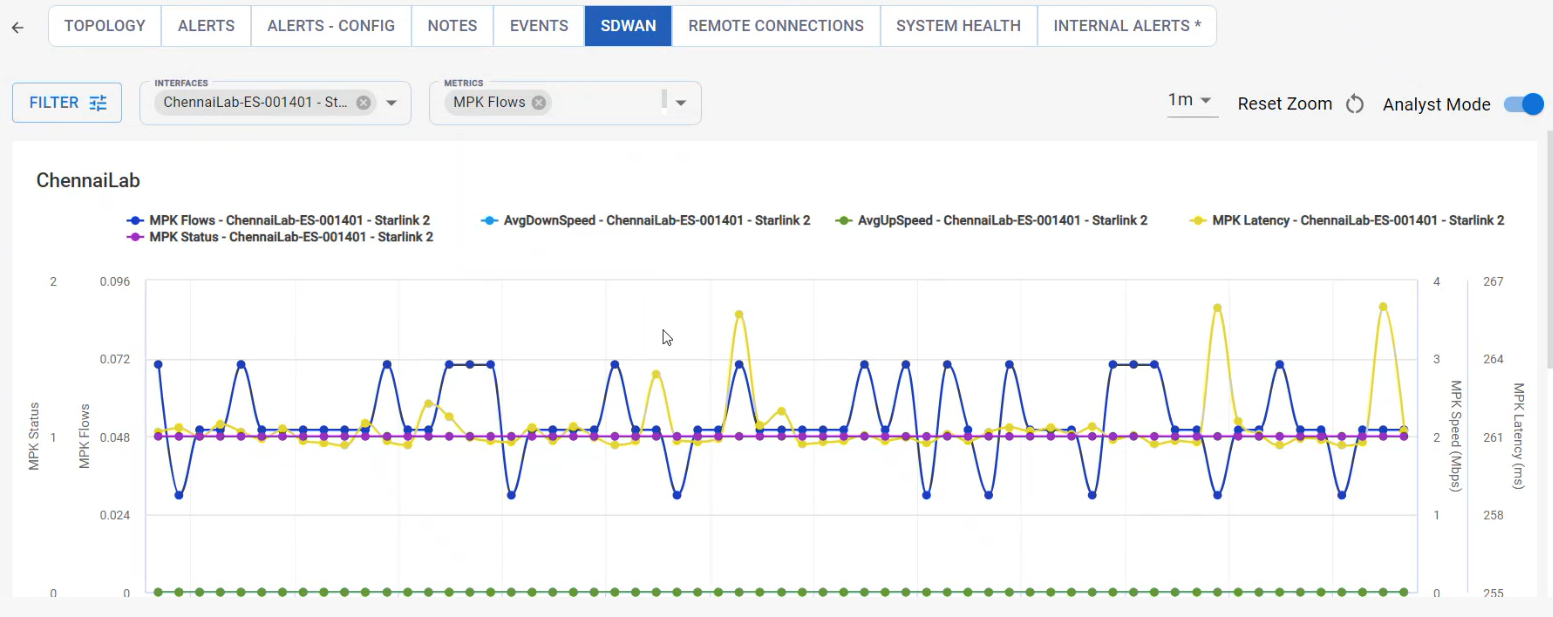
SDWAN