
-
Click Firewall tab in the Reports screen.
-
The Firewall tab enables the user to view reports about the Firewall rules set for the selected organization.
-
Users can view information such as:
-
The Top Denied rule
-
The Top Allowed rule
-
Percentage of allowed and denied rules
-
The most utilized rules
-
List of all rules set for the organization
-
-
In the Organization field, select the Organization or sub-organization from the dropdown menu. The logged in admin Organization is populated by default here. This is the organization corresponding to the email ID used to login.
-
The dropdown list consists of all the sub-organizations under logged in admin organization.
-
Select the Sites from the dropdown menu.
-
Select the Period from the dropdown menu.
-
By default, the time interval selected is last one hr. The user can also select a custom time interval using the From and To fields.
-
The Firewall tab shows the data as shown in the below figure.
-20240524-153152.png?cb=6fc7bd56d6d922cf3ba2397f36b1e109)
-
Click the Generate Report button to download the Firewall reports.
Headers
The headers show the following information:
-
Top Denied - The Firewall rule that was used to deny the maximum number of packets. The Site name and number of packets is also shown.
-
Top Allowed - The Firewall rule that was used to allow the maximum number of packets. The Site name and number of packets is also shown.

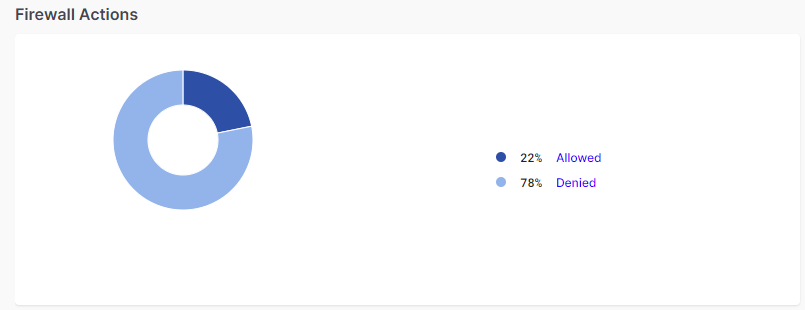
Firewall Actions
The Firewall Actions pie chart groups the firewall rules set by the users into Allowed and Denied categories and shows the percentage of each category. Hovering on any item on the pie chart highlights the category and shows number of rules in that category.
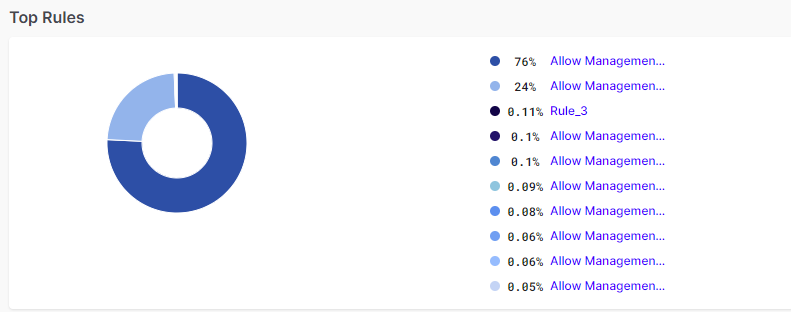
Top Rules
The Top Rules pie chart shows the most used Firewall Rules and shows their percentage. Hovering on any item on the pie chart highlights the category and shows number of packets in that category.
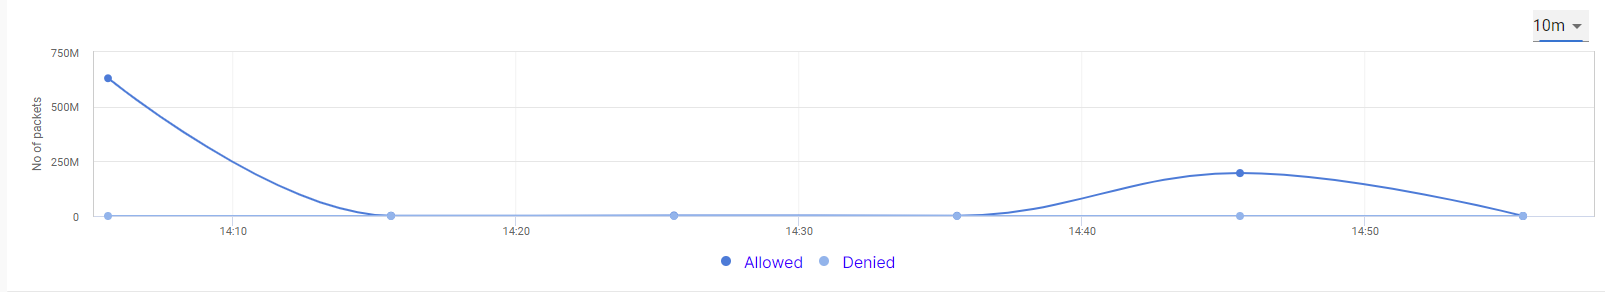
The line chart shows the amount of allowed and denied packets at different time instances. The horizontal axis contains the time instances, and the vertical axis contains the amount of packets. The graph between these two axes gives the user a clear understanding of how the firewall rules have been utilized over the selected time period.
Select the dropdown menu at the top right corner of the chart to change the time interval on the chart.
-
All the blue highlighted text in the Firewall screen is clickable. It can be the name of a site, name of a rule, or rule category. Clicking it filters the entire screen and displays the firewall rules information corresponding only to that site, rule, or rule category.
Firewall Table
The Firewall section shows a table that lists all the rules set under the selected organization. The Table shows the following information:
-
Rule Name - Name of the rule.
-
Site Name – Name of the Site.
-
Protocol
-
Source Interface
-
Source IP Domain
-
Source Port
-
Destination Interface
-
Destination IP Domain
-
Destination Port
-
No of Packets– Total number of packets used for the rule.
-
Action – Type of rule (Allowed/Denied)
Click the Download button to download the Firewall rules data locally in CSV format.
-20240524-162042.png?cb=a7fc0bffcc35edfcbd25d56d87ff5a56)
Generate Report
-
Click the Generate Report button to generate the Reports.
-20250821-124122.png?cb=f5ce473f2eb96fd02fbd8c39573616c6)
-
Also, if the user selects a date range of more than 7 days to view activity reports, they will be asked to Generate Reports and view the data.
-
Select the Start Date and Start Time using the date picker and the clock.
-
Select the End Date and End Time using the date picker and the clock.
-
Select the Organization from the dropdown menu.
-
Select the Site from the dropdown menu.
-
Select the MAC/IP from the dropdown menu. This field is optional.
-
Select the Application Category from the dropdown menu. This field is optional.
-
Select the Application from the dropdown menu. This field is optional.
-
Select the VLAN from the dropdown menu. This field is optional.
-
Select the WAN Type from the dropdown menu. This field is optional.
-
Select the Format from the dropdown menu. The options available are xlsx/csv.
-
To download the Detailed Flow Report, select the Detailed Flow Report checkbox.
-
Click Generate button to start generating the report.
-
Click the Generated Reports tab from the Reports page to view the status of the generated report.
-20250821-124548.png?cb=b61768cb85e35033702270395f821c7f)
-
The Generated Reports tab shows a table that lists all the reports generated from the Activity Reports screen. It shows information such as Requested At date and time, Generated At date and time, Metadata, Status, Report Type, Summary and Flow Report.
-
Click the
-
The status of the generated report would be shown as ‘INPROGRESS’ when the report is being generated.
-
Once the report generation process is complete, the status changes to ‘COMPLETED’ and the Download button under the Summary column gets enabled.
-
Click Download button under the Summary column to download the Report.
-
If the user had selected the Detailed Flow Report checkbox while generating the report, the Download button under the Flow Report column will also be enabled.
-
Click Download button under the Flow Report column to download the Detailed Activity Report in CSV format.