
Content Filter
This manual provides a step-by-step guide for setting up and using the Content Filter screen in Kognitive Cloud. The Content Filter screen allows users to create and manage filtering rules for Organizations and Sub-organizations. These rules help block access to malicious or inappropriate content, including categories such as criminal activities, hacking, pornography, phishing, gambling, and more.
By leveraging these filtering capabilities, administrators can enforce security policies, prevent access to harmful websites, and ensure compliance with organizational guidelines. The intuitive interface simplifies rule creation and management, allowing users to customize filtering settings based on specific needs. Additionally, real-time monitoring and logging features provide insights into blocked attempts and help fine-tune security measures.
Login to Kognitive Cloud using valid user credentials.
Select Content Filter option from the left menu bar.
The Content Filter screen opens as shown in the below figure.
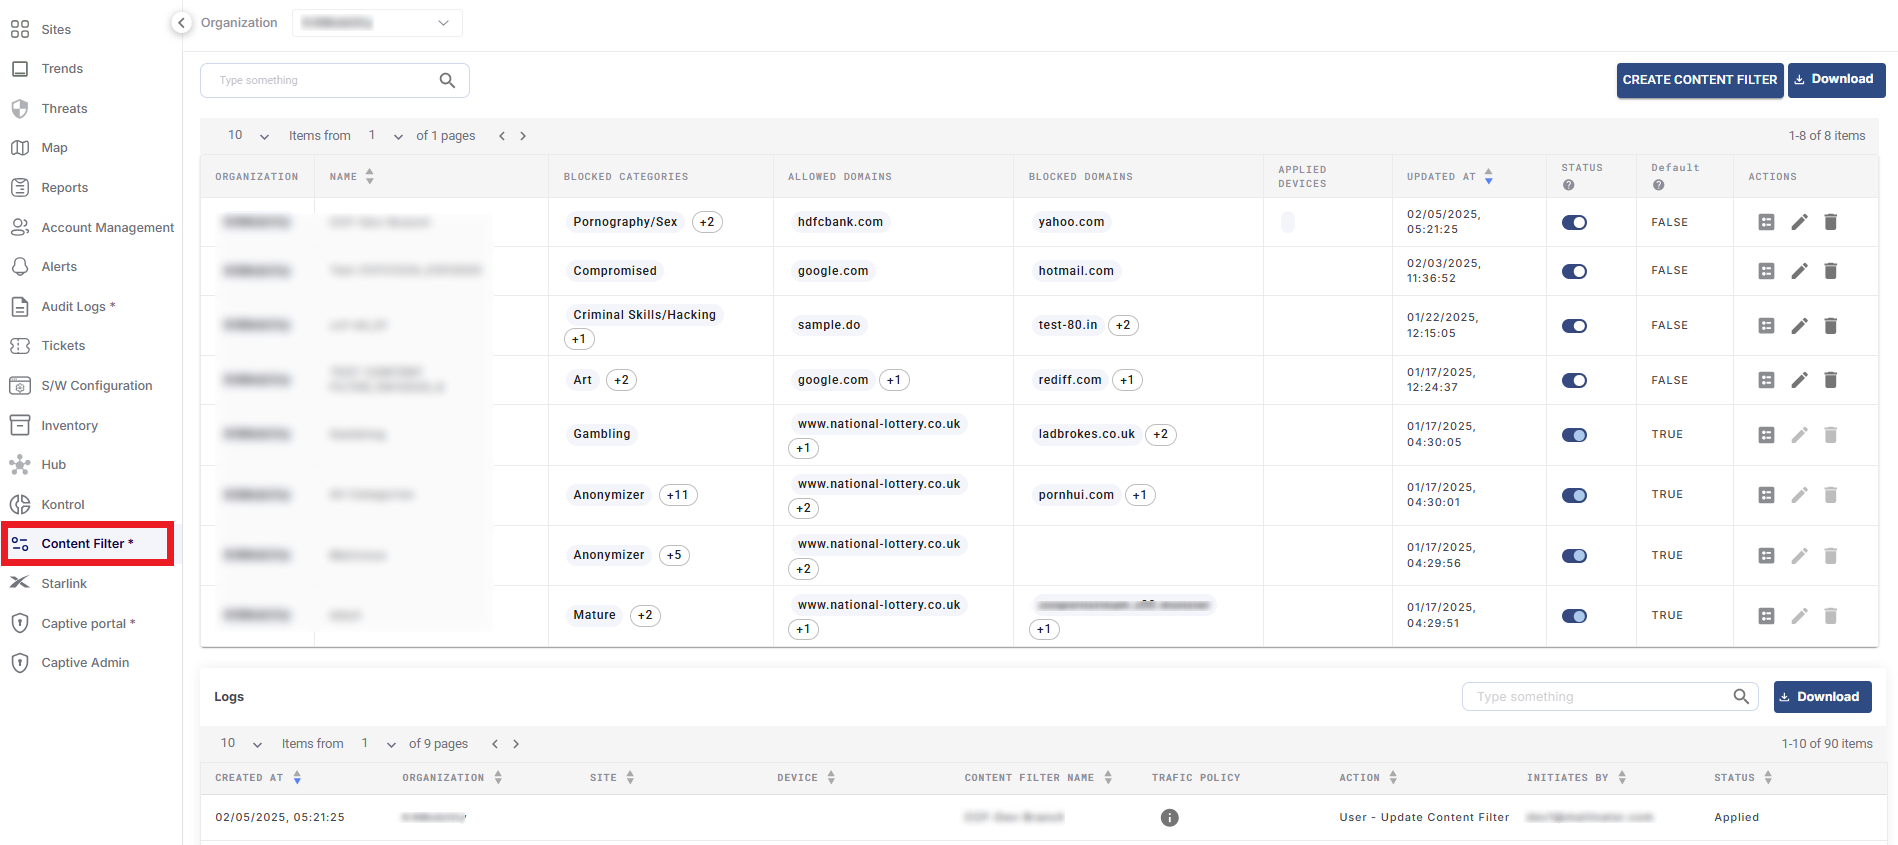
Content Filter Page
In the Organization field, select the Organization or sub-organization from the dropdown menu. The logged in admin Organization is populated by default here. This is the organization corresponding to the email ID used to login.
The dropdown list consists of all the sub-organization’s under logged in admin organization.
Create Content Filter
Select the Create Content Filter button to create a content filter. The Create Content Filter dialog box opens.
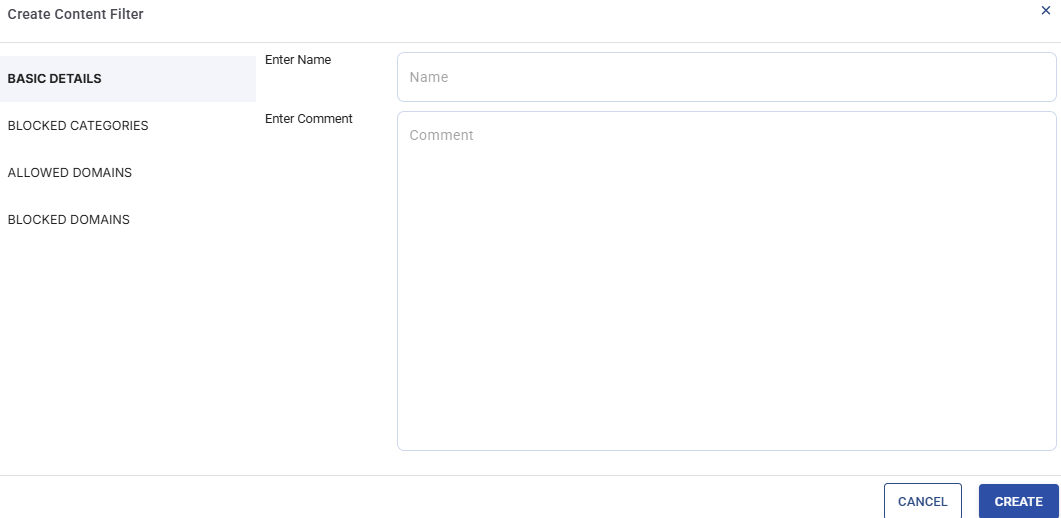
Create Content Filter
The Basic Details option from the left menu bar will be selected by default.
Enter the Name of the content filter.
In the Comment field, enter a description about the content filter.
Select the Blocked Categories option from the left menu bar.
All the available categories of content that can be blocked is shown the right panel.
Select the checkboxes of the categories that should be blocked.

Blocked Categories
Select the Allowed Domains option from the left menu bar.
In the Domain Name field, enter the domains that should be allowed access irrespective of the blocked categories set in the previous fields.
Click the Include Subdomains toggle button to allow access to the subdomains as well.
Click the + Add button to add the domain. The added domains will be shown under the Domain List table.
Click the Download CSV button to download the Allowed Domains data in CSV format.
The Domains can also be added in bulk. Click the Sample CSV button to download the sample file.
Enter the Domain data and save the file.
Click the Upload CSV button and upload the file.
The domain data entered in the file will be validated by the system and allowed domains will be added in bulk.
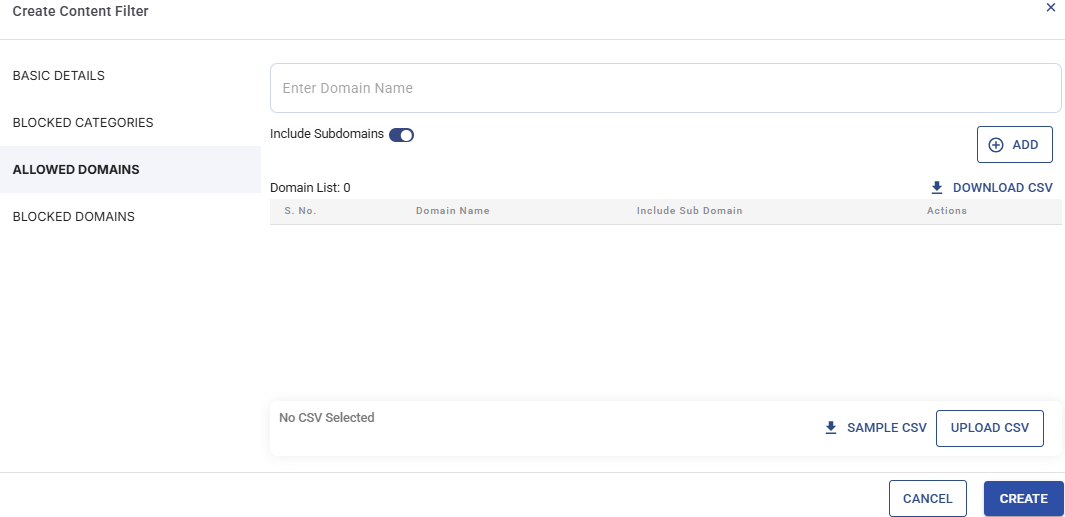
Allowed Domains
Select the Blocked Domains option from the left menu bar.
In the Domain Name field, enter the domains that should be denied access specifically.
Click the Include Subdomains toggle button to deny access to the subdomains as well.
Click the + Add button to add the domain. The added domains will be shown under the Domain List table.
Click the Download CSV button to download the Blocked Domains data in CSV format.
The Domains can also be added in bulk. Click the Sample CSV button to download the sample file.
Enter the Domain data and save the file.
Click the Upload CSV button and upload the file.
The domain data entered in the file will be validated by the system and blocked domains will be added in bulk.

Blocked Domains
Click the Create button to create the content filter.
The table shows all the content filtering rules created in the system. It shows the following information:
Organization - Name of the Organization
Name - Name of the Content filtering rule
Blocked Categories - The content categories designated for blocking by the rule
Allowed Domains - The domains allowed regardless of the blocked categories
Blocked Domains - The domains designated for blocking by the rule
Applied Devices - Devices on which the content filtering rule is applied
Updated at - The date and time of the rule's last update
Status - Enable / Disable the content filter. When disabled, the content filter will be removed from the devices
Default - Indicates whether this rule is set as the default content filter
Action Buttons
The Actions column contains three icons:
Apply Traffic Policy
Click the Apply Traffic Policy
 icon to apply the content filter rule on the traffic policy.
The Apply Content Filter on Traffic Policy dialog box opens.
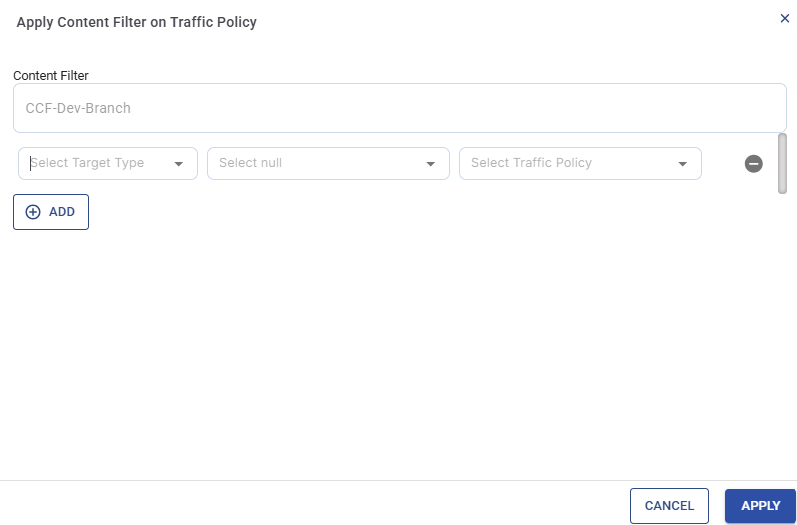
Apply Content Filter on Traffic Policy
The name of the content filter is already auto populated in the Content Filter field.
Select the Target Type from the dropdown menu. The user has three options to select the target type.
Site - The selected content filter will be applied to all the devices of the selected sites. The user must further select the required sites from the new Select Site field.
Device - The selected content filter will be applied to only the selected Target devices. The user must further select the required devices from the new Select Device.
Managed Group - The selected content filter will be applied to all the devices under the selected Groups. These groups can be created in the Group Actions tab of the Inventory screen in Kognitive Cloud. The user must further select the required groups from the new Managed Group field.
In the Select Traffic Policy field, select the required traffic policy on which the content filter should be applied. The traffic policies in the dropdown menu will be shown based on the Target Types selected in the previous fields.
Select the
 button to add another row of target types.
Select the Apply button to apply the content filter on the selected traffic policies.
Edit
Click the Edit
 icon to edit the content filter. The Edit Content Filter dialog box opens.
Click the required tabs from the left menu bar and make the necessary changes.
Delete
Click the Delete
 icon to delete the content filter.
Delete action on the content filter will first remove the association of content filter from traffic policies in the applied devices and then the content filter is deleted from the system. Once deleted, it will not be available for use anymore. Traffic policies associated earlier with the deleted content filter will not be associated with a content filter until admin applies another content filter to those traffic policies again.
Logs
The Logs table shows the complete log of all content filter events. These events include Creation, deletion, updation and applying of the content filters.
-20250206-085907.png?inst-v=9fcc34d5-360e-4e5f-a2f3-b66bb6c2a5f7)
Logs
The table shows the following information:
Created At - Shows the date and time of creation of the event
Organization - Name of the Organization
Site - Name of the Site
Device - Name of the device on which the event occurred
Content Filter Name - Name of the content filter
Traffic Policy - Traffic policy on which the content filter is applied
Action - Type of event occurred
Initiated By - The username of the user that initiated the action
Status - Status of the content filter action