
Generated and Scheduled Reports
Click Scheduled Reports tab in the Reports screen. The Scheduled Reports tabs allows users to:
View and download reports manually generated from the Activity, Firewall & Content Filter tabs.
Schedule recurring reports (Monthly)
View and Download reports generated through scheduled report configurations
View, edit, and manage scheduled report configurations
-20250806-080404.png?inst-v=d7528f82-965b-4c00-b9f0-a1a72f499c29)
Scheduled Reports Tab
The two sections available to the user are:
Reports Scheduler
Scheduled Reports
Reports Scheduler
This section allows Admin users to create and manage scheduled report configurations.
-20250806-080855.png?inst-v=d7528f82-965b-4c00-b9f0-a1a72f499c29)
Reports Scheduler
Create New Report Schedule
Click on the + Add button to add a new report schedule.
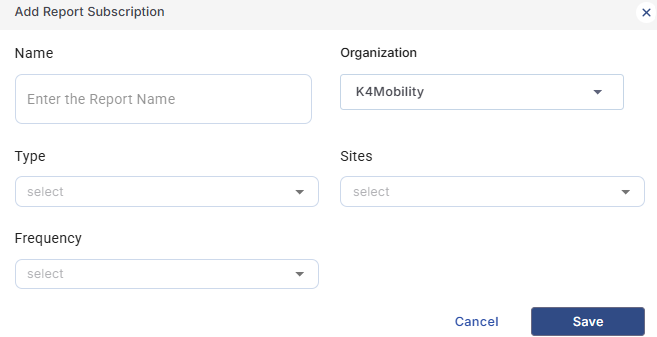
Add Report Schedule
Select the Report Name.
Select the Organization, Report Type, Site, Service Line (when necessary).
The types of reports that can be scheduled are - WAN Usage, Access Network Usage, Captive Usage, Starlink Usage and Threat Report.
Select the Frequency of report generation.
Click Save to save the schedule.
Report Scheduler Table
The created report schedules will be listed in the table under the Report Scheduler section.
The table shows the following information:
Name - Custom name for the scheduled report
Use the Toggle button
 next to the name of the report to enable or disable a scheduled report without deleting it.
Organization - The parent organization the report belongs to
Site - Target site(s) for site-level reports
Service Line - Applicable service line(s) for Starlink or similar usage reports
Type - Type of report (WAN, Access Network etc.)
Frequency - Schedule frequency (Monthly)
Scheduled On - The next date on which the report would be auto-generated again based on the Report Schedule. For monthly schedule, it will be the first day of the coming month
Action -
Click the Edit icon next to a report entry to edit the schedule configurations
Click the Delete icon to delete a report schedule
Select the Filter button to filter the Report Scheduler table based on the Type, Sites, Service Lines and Frequency.
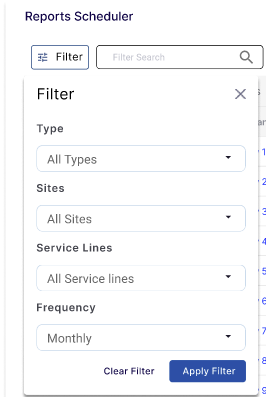
Filter
Select the required parameters and click the Apply Filter button to filter the table and display the results accordingly.
Scheduled Reports
The Scheduled Reports section displays all auto-generated reports based on configured schedules, as well as reports manually generated from the Activity, Firewall & Content Filter tabs.
-20250806-111111.png?inst-v=d7528f82-965b-4c00-b9f0-a1a72f499c29)
Reports
The table shows the following information:
Organization - Organization associated with the report
Site - Name of the site
Service Line - Name of the Service line (if applicable)
Type - Report category
Frequency - Schedule frequency (Monthly) - The schedule frequency for manually generated reports would be NA
Status - The status of the generated report would be shown as ‘INPROGRESS’ when the report is being generated. Once the report generation process is complete, the status changes to ‘COMPLETED’
Date Generated - Date when the report was created
Scheduled On - The next date on which the report would be auto-generated again based on the Report Schedule. For monthly schedule, it will be the first day of the coming month
Action - Click the
 Download icon to Download the report
Click the Search field to search for the reports based on the Organization/Site/Service Line/Type.
Click the Filter button to filter the reports based on the following categories:
User can select the Type of report from the option in the dropdown menu.
User can select the Sites from the dropdown menu.
User can select the Service Lines from the dropdown menu.
User can select the Frequency.
User can select the Generated At date.
User can select the Scheduled On date.
The reports table will be filtered and show the results corresponding only to the options selected in the filters.
Access Levels and Permissions
Admin Access - Full access to all three sections (configure schedules, view/download reports).
Report Access - View/download reports only. Cannot configure new schedules. No access to other Kognitive Cloud pages.
Other Users - View only Generated Reports relevant to their assigned role
Types of Reports and Field Definition
WAN Usage Report
The WAN Usage Report displays detailed usage statistics for all WAN interfaces of the device. It provides insights into data consumption over a selected period, including total data usage, and interface-specific breakdowns. This report helps in monitoring network performance, identifying usage patterns, and managing bandwidth allocation across different WAN connections.
The WAN Usage Report consists of the following fields:
Date - Date of report generation
Site Name - Name of the Site
Device ID - Identification number of the device
WAN Interface 1 - Amount of data consumed by WAN Interface 1 in GB
WAN Interface 2 - Amount of data consumed by WAN Interface 2 in GB
Total - Amount of total data consumed by all WAN Interfaces of the device in GB
Access Network Usage Report
The Access Network Usage Report shows detailed usage information for all access networks on the device. It provides data consumption statistics over a selected period, including total usage, and network-specific breakdowns. This report helps track how individual access networks are utilized, monitor performance, and identify usage patterns, enabling better bandwidth management and troubleshooting.
The Access Network Usage Report consists of the following fields:
Date - Date of report generation
Site Name - Name of the Site
Device ID - Identification number of the device
Access Network 1 - Amount of data consumed by Access Network 1 in GB
Access Network 2 - Amount of data consumed by Access Network 2 in GB
Total - Amount of total data consumed by all Access Networks of the device in GB
Captive Usage Report
The Captive Usage Report provides comprehensive usage statistics for all captive user accounts associated with the selected organization and sites. It is designed to give both high-level and granular insights into captive user activity and data consumption. The report is divided into two tabs: Summary and Detailed.
Summary Tab – Displays aggregated statistics over a selected period, including the plan names assigned to users, plan validity periods, quota allocations, and total data usage per user.
Detailed Tab – Provides session-by-session information such as session ID, login and logout times, data usage, device details, and activity breakdowns.
This report offers both total usage metrics and user/session-specific breakdowns, enabling administrators to:
Monitor captive user behavior and data consumption patterns.
Evaluate quota utilization against plan limits.
Identify high-usage users or unusual activity trends.
Support capacity planning, troubleshooting, and billing validation.
By combining both summary and detailed views, the Captive Usage Report ensures complete visibility into captive network utilization across the organization.
The Captive Usage Report consists of the following fields:
Summary Tab:
User Name - Username of the captive user account
Site ID - Identification Number of the site
Site Name - Name of the site
Plan Name - Name of the plan assigned to the user
Plan Start (UTC) - Date and time when the plan started
Plan End (UTC) - Date and time when the plan ends
Plan Quota (GB) - The total amount of data allocated for the plan, measured in gigabytes
Topups - The number of top-ups applied to the plan
Topup Size (GB) - The total amount of data added through top-ups
Sessions - The total number of login sessions initiated by the user
Data Usage (GB) - The total amount of data consumed by the user
First Activity At - The date and time when the first activity was recorded for the user account
Last Activity At (UTC) - The date and time when the most recent activity was recorded for the user account.
Detailed Tab:
Site ID - Identification Number of the site
Site Name - Name of the site
Session ID - Identification Number of the session
Login Date (UTC) - Date and time when the user logged in for the session
Logout Date (UTC) - Date and time when the user logged out from the session
Username - Username of the captive user account
Data Usage (GB) - The amount of data consumed during the session
Plan Name - Name of the plan assigned to the user
Plan Start (UTC) - Date and time when the plan started
Plan End (UTC) - Date and time when the plan ends
Plan Quota (GB) - The total amount of data allocated for the plan
IP Address - IP address of the device used during the session
MAC Address - MAC Address of the device used during the session
Host Name - Name of the host device
First Activity At (UTC) - Date and time when the first activity was recorded in the session
Last Activity At (UTC) - Date and time when the most recent activity was recorded in the session
Logout Cause - The reason for the session termination (e.g., timeout, manual logout, quota exhaustion)
Created At - The date and time when the session record was created in the system
Starlink Usage Report
The Starlink Usage Report shows detailed usage information for all selected Starlink Service lines. It provides data consumption statistics over a selected period, including Account number, Kit Number, Service line details, Service plan, Total Priority, Opt In Priority, Standard, Non Billable and Total data usage. This report helps track how individual service lines utilize data, monitor performance, and identify usage patterns, enabling users to make informed business decisions.
The Starlink Usage Report consists of the following fields:
Date - Date of report generation
Account Number - Number of the service account
KIT Serial Number - Identification number of the KIT
Service Line Name - Name of the Service line
Site Name - Name of the Site
Service Plan - Name of the Service Plan
Total Priority (GB) - Total Amount of Priority data consumed in GB
Total Opt In Priority (GB) - Total Amount of Opt In Priority data consumed in GB
Total Standard (GB) - Total Amount of Standard data consumed in GB
Total Non Billable - Total Amount of Non Billable data consumed in GB
Total Usage (GB) - Total Amount of data consumed in GB
Threat Report
The Threat Report provides comprehensive visibility into all threats detected over a selected period. It enables administrators to monitor, analyze, and respond to security incidents by offering both summarized and detailed views of threat activity. The report is organized into three tabs:
Summary Tab – Displays aggregated threat statistics for the chosen time frame, including device details, threat class, total threat count, severity level, and attack timestamps. This view offers a quick overview of the security posture across devices.
Endpoints Tab – Lists affected devices with their IP addresses, total threat counts, and a category-wise breakdown of detected threats. This helps identify which endpoints are most frequently targeted or vulnerable.
All Data Tab – Provides a complete log of all recorded threats, including site details, device details, threat classes, severity, mitigation actions performed, destination IP (DST IP), source IP (SRC IP), and protocol used. This detailed dataset supports in-depth security analysis and forensic investigations.
The Threat Report assists in:
Tracking the volume and types of threats over time.
Identifying high-risk devices, IP addresses, and protocols.
Understanding the severity and nature of attacks to prioritize remediation.
Supporting compliance reporting and security audits.
By combining summary insights, endpoint-specific data, and full detailed logs, the Threat Report serves as a vital tool for proactive threat management and incident response.
The Threat Report consists of the following fields:
Summary Tab:
Date - The date for which the threat data is reported
Site ID - Identification Number of the site
Site Name - Name of the site where the threat was detected
Device Name - Name of the device on which the threat was identified
Name - The name of the detected threat
Class - The classification of the threat
Count - The total number of occurrences of the threat during the reporting period
Severity - The severity level assigned to the threat
Last Attack Time (UTC) - The date and time when the most recent occurrence of the threat was detected
Endpoints Tab:
Date - The date for which the threat data is reported
Site ID - Identification Number of the site
Site Name - Name of the site where the threat was detected
Device Name - Name of the device on which the threat was identified
User Name - The username associated with the device or account where the threats occurred
IP Address - IP Address from which the threats originated or were detected
Count - The total number of threats detected for the user or device during the reporting period
Critical - The number of threats classified as Critical severity, indicating the highest level of potential impact
High - The number of threats classified as High severity, indicating a significant security risk
Medium - The number of threats classified as Medium severity, indicating a moderate security risk
Low - The number of threats classified as Low severity, indicating minimal potential impact
All Data Tab:
Attack Time - The date and time when the threat was detected
Site ID - Identification Number of the site
Site Name - Name of the site associated with the threat
Device Name - Name of the device on which the threat was detected
Name - The specific name of the detected threat
Class - The classification of the threat
Severity - The assigned severity level of the threat (e.g., Low, Medium, High, Critical) indicating its potential impact
Action - The mitigation action taken
DST IP - The destination IP address targeted by or associated with the threat
SRC IP - The source IP address from which the threat originated
Interface - The network interface through which the threat traffic was detected
Protocol - The network protocol used during the threat event (e.g., TCP, UDP, ICMP)
Metadata - Additional contextual information or attributes related to the detected threat
Point to note
Reports are retained for 6 months.
Only Starlink service line admins can schedule Starlink reports.
Only Site admins can schedule site-level reports.