
Weighting Charts
The Weighting Charts area provides time chart functionality of Bandwidth Bonded Internet Source (WAN) link performance over selectable time periods.
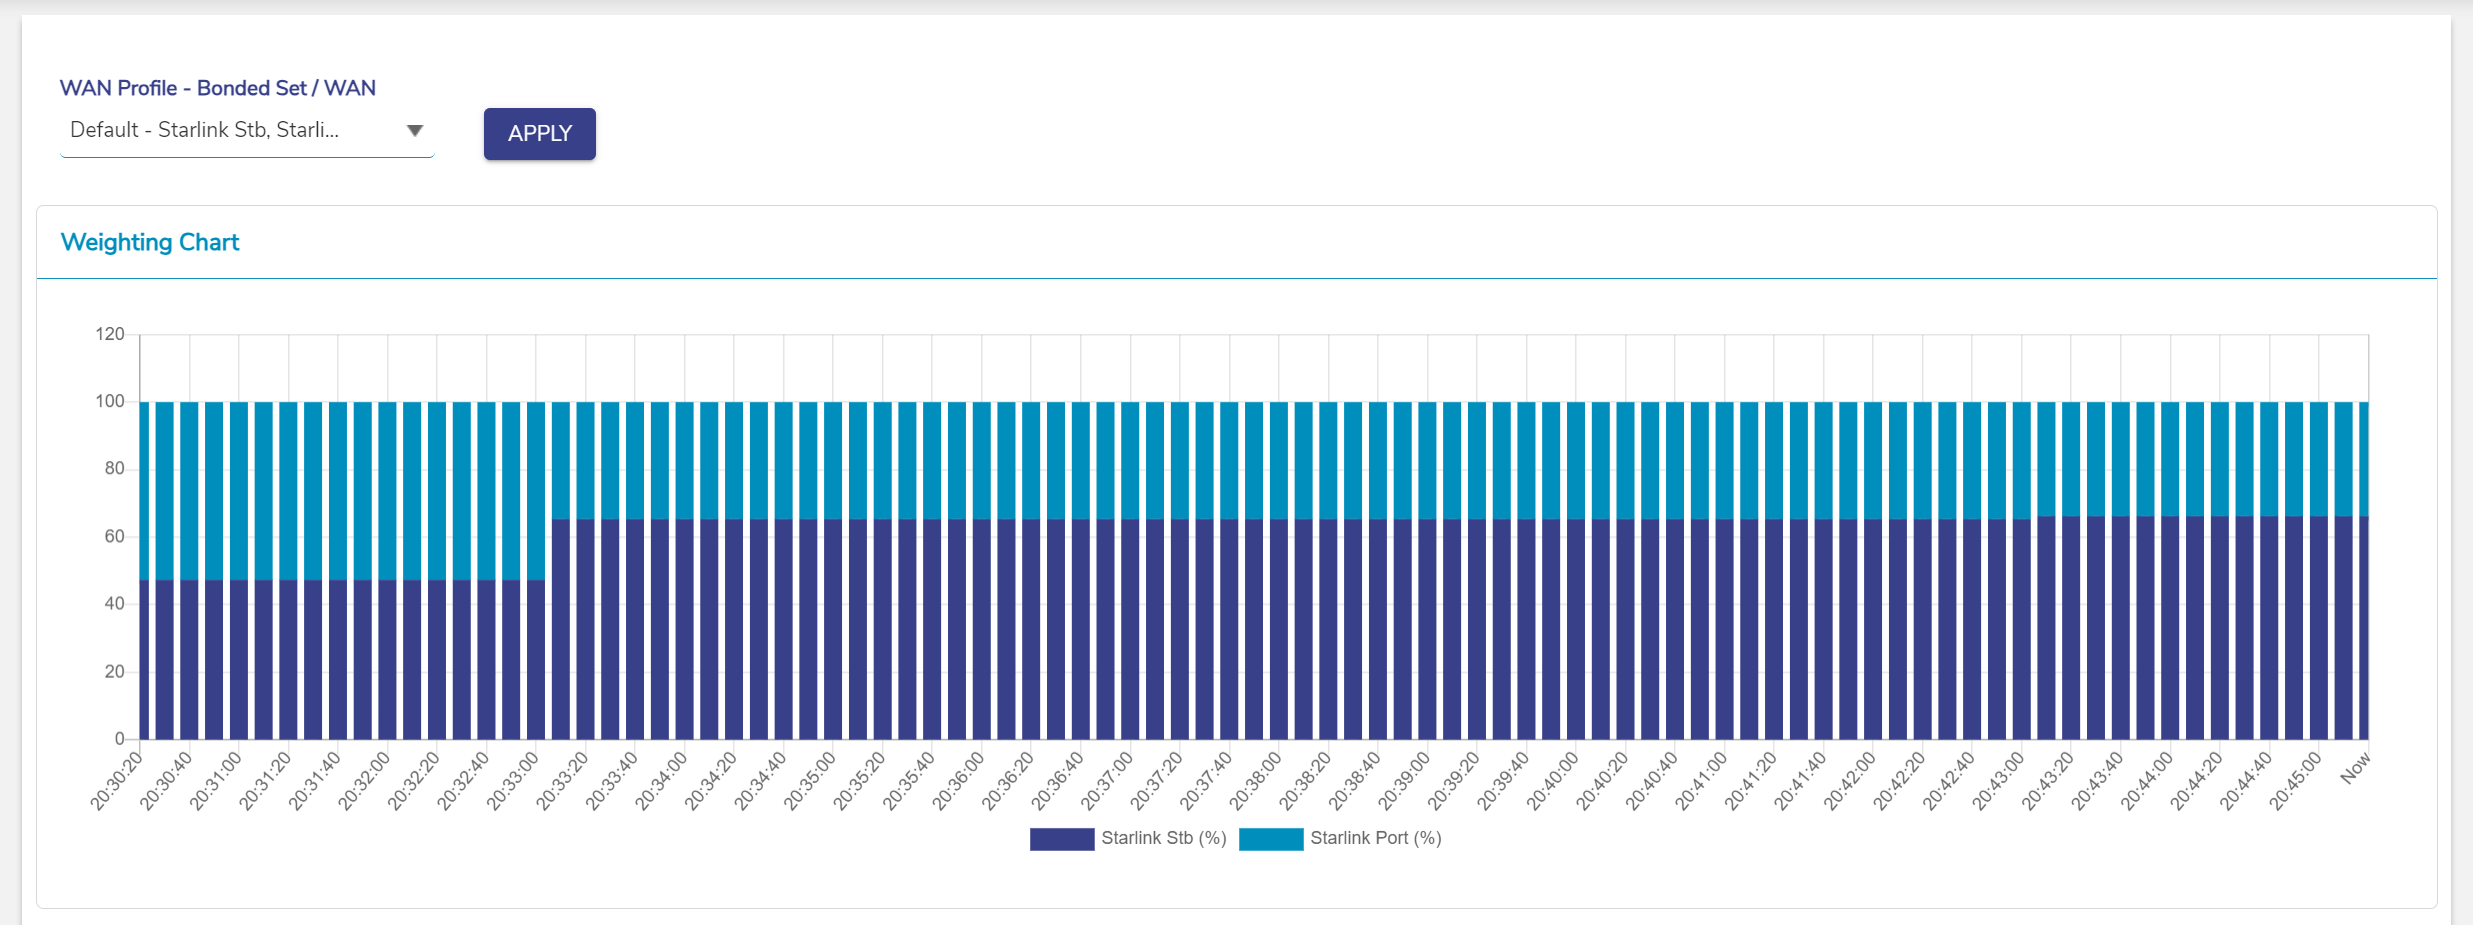
The Weighting Chart depicts the percentage of each WAN source that was used in the Bonded Set.
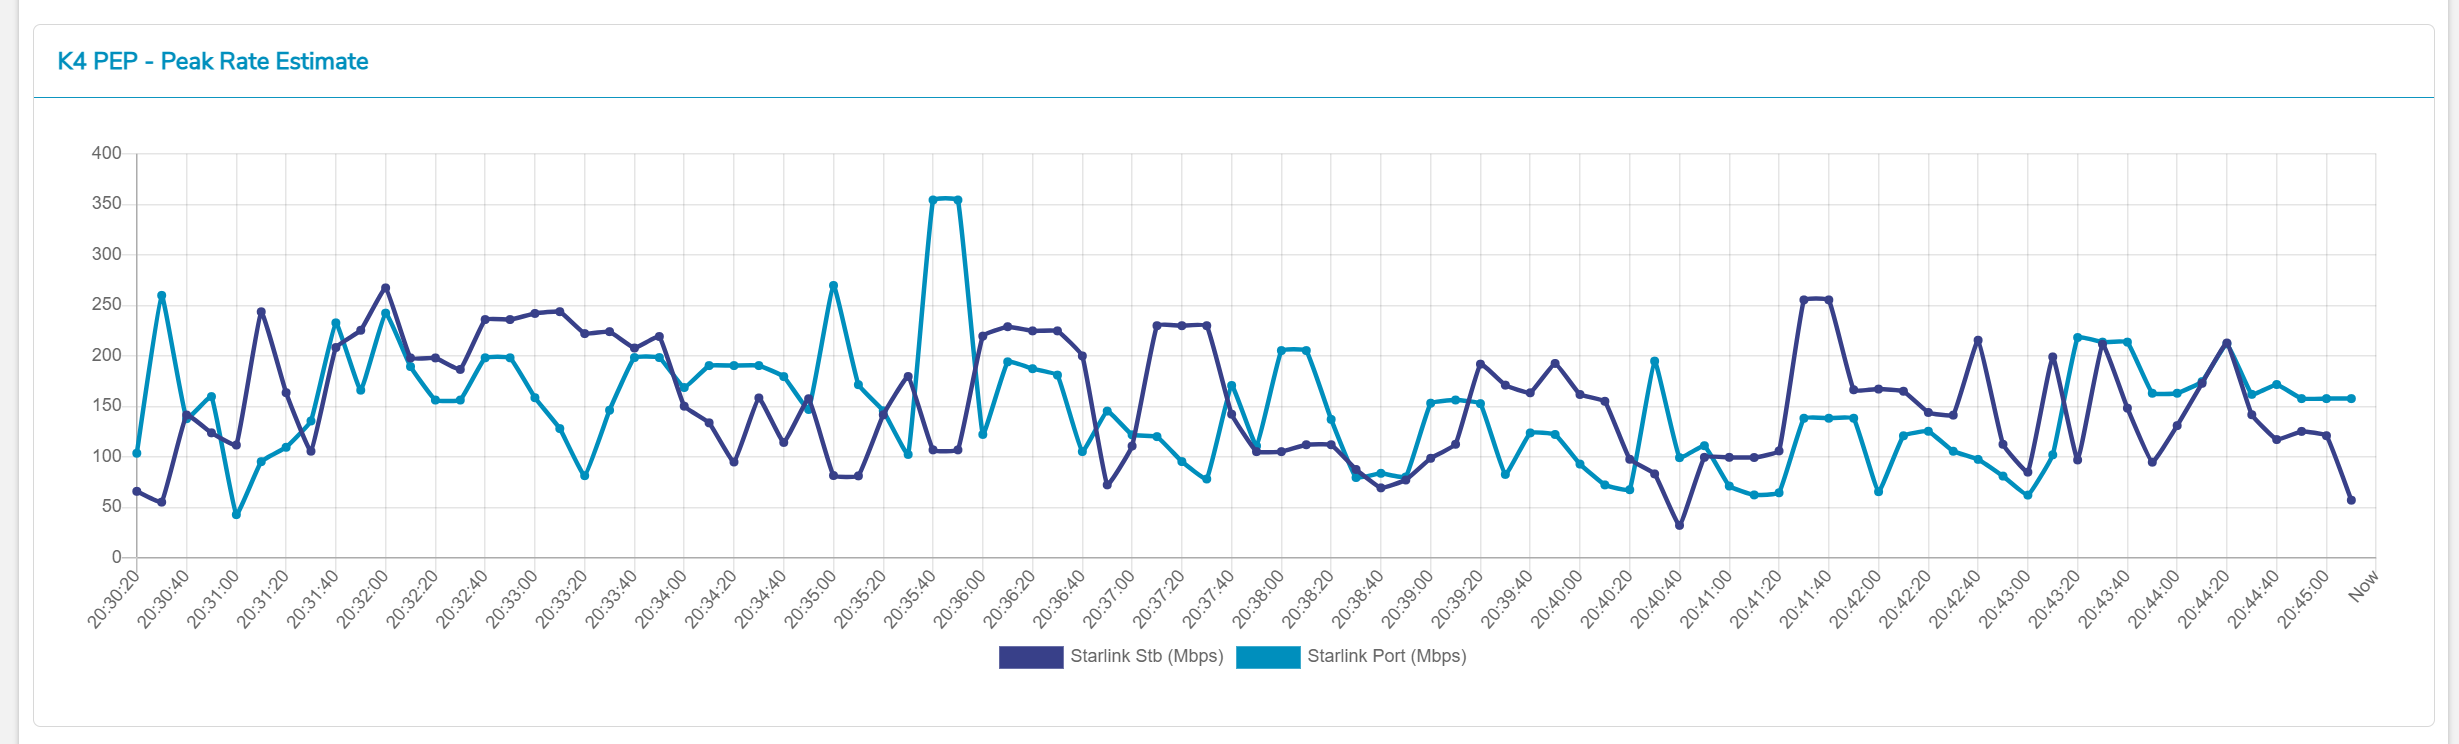
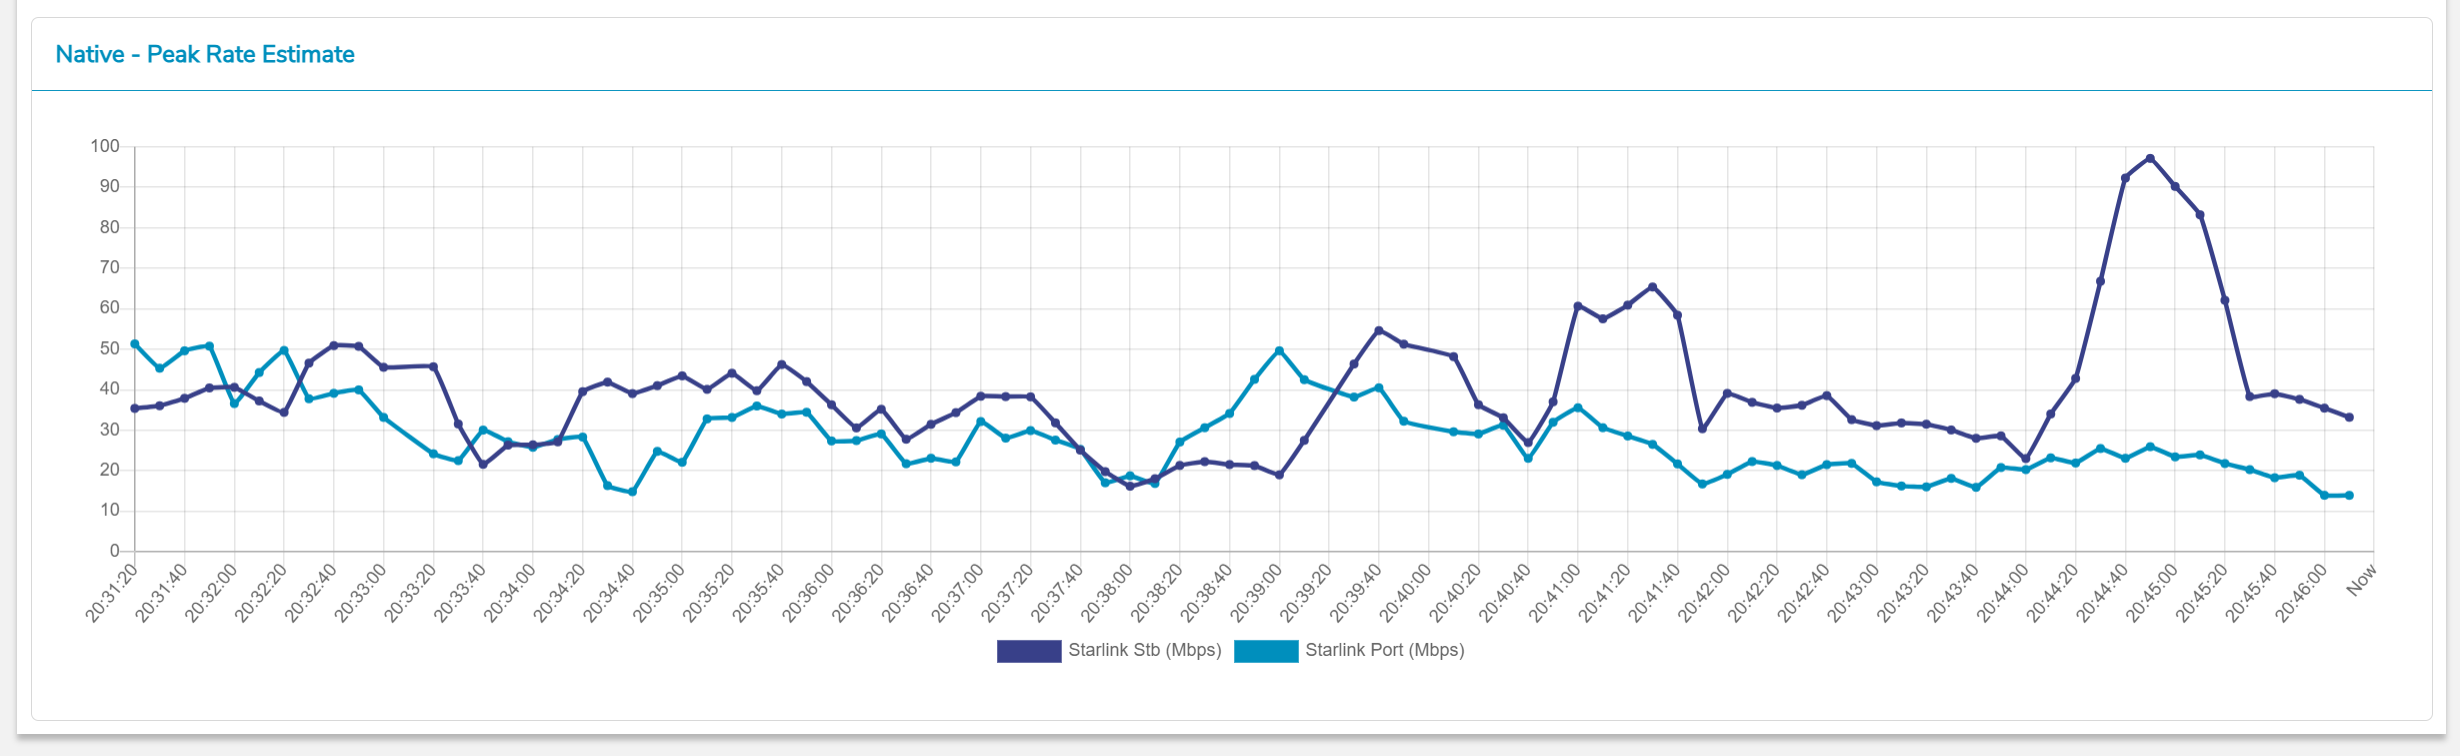
Native Peak Rate Estimates and PEP (Performance Enhancing Proxy) Peak Rate Estimates are also plotted for the selected Bonded Set’s component WAN sources, for a better look into the details of each link and the connection health.
Once the EdgeOS System is audited and possibly reconfigured, user can view the weighting % of the bonded interfaces at the periodicity of 10 seconds. If the US internet is down, then only the Native - Peak Rate Estimate chart becomes available, and the weighting of the bonded interfaces is performed based on the Native - Peak Rate Estimate. If the US internet is up, then the PEP - Peak Rate Estimate chart also becomes available, and the weighting of these bonded interface is done based on the PEP - Peak Rate Estimate.
Note: This menu item is available for administrative users only.
Viewing Weighting Charts
To view the weighting %, perform the following steps.
Steps
· Log on to the EdgeOS System. The home page appears.
· Click the menu icon. The menu appears.
· Click Weighting Charts. The Weighting Charts page appears, see figure below.
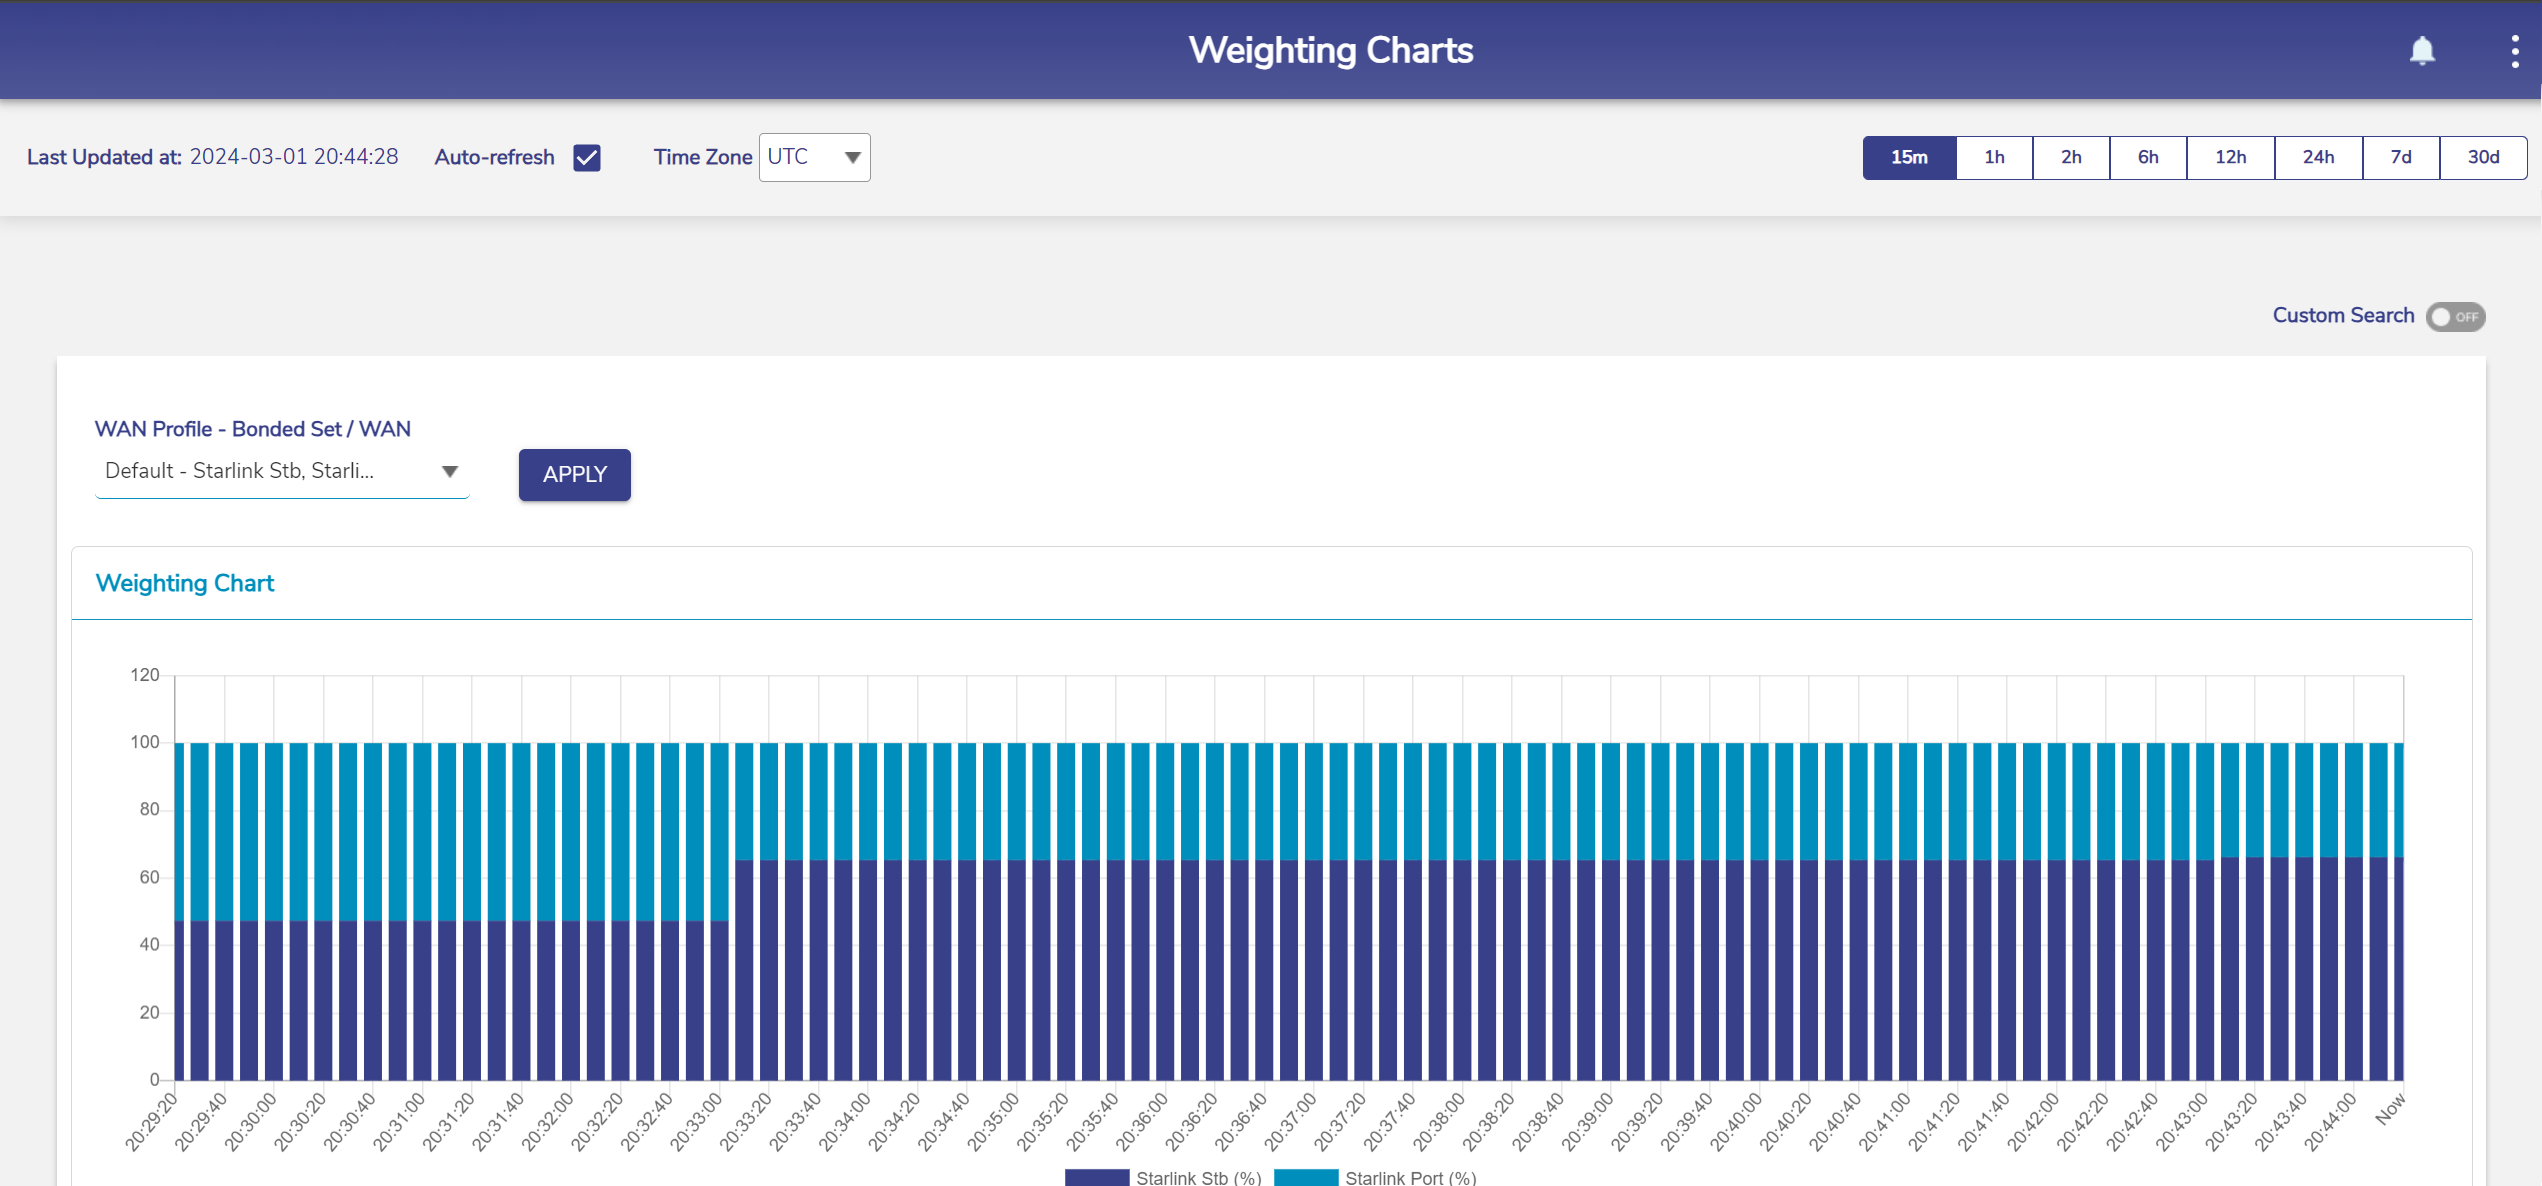
Weighting Charts
For description of the fields in Weighting Charts, see Table below.
Fields | Description | Configuration |
Auto-refresh | Whether the data on the page is to be refreshed automatically. Data is updated at an interval of 30 seconds. | To automatically refresh the details of the WAN link, select the Auto-refresh check box. |
Time Zone | To access the details of the WAN link based on the time zone. By default, the UTC is configured. To view data at a period of 15m, 1h, 2h, 6h, 12h, 24h, 7d, and 30d, where, · m is minutes · h is hours · d is days By default, the periodicity of 15m is configured. | In the Time Zone link, click a time zone, see Figure Time Zone. |
Click the periodicity at the upper-right corner of the page. | ||
Custom Search |
|
Steps
|
WAN Profile - Bonded Set / WAN | Bonded set for which Weighting Charts need to be viewed. | To view the weighting chart, perform the following steps. Steps
|
Weighting Charts Fields
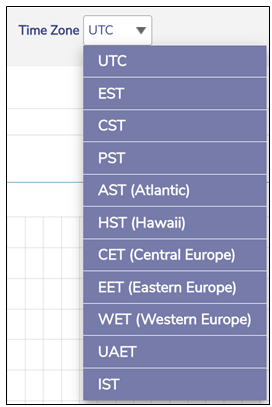
Time Zone
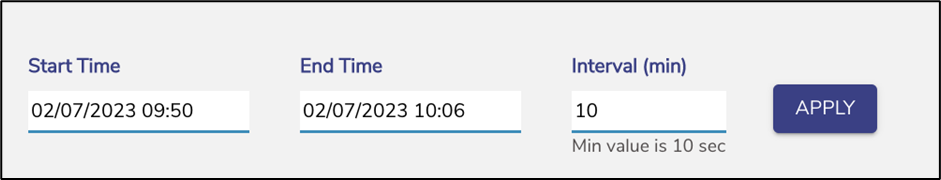
Custom Search

WAN Profile - Bonded Set/WAN