
Performance Charts
The Performance Charts area provides comprehensive time chart functionality to plot Internet Source (WAN) links metrics over selectable time periods for any given Network. Once the EdgeOS System is configured, user can monitor the performance of the interface or WAN links.
The following metrics are available:
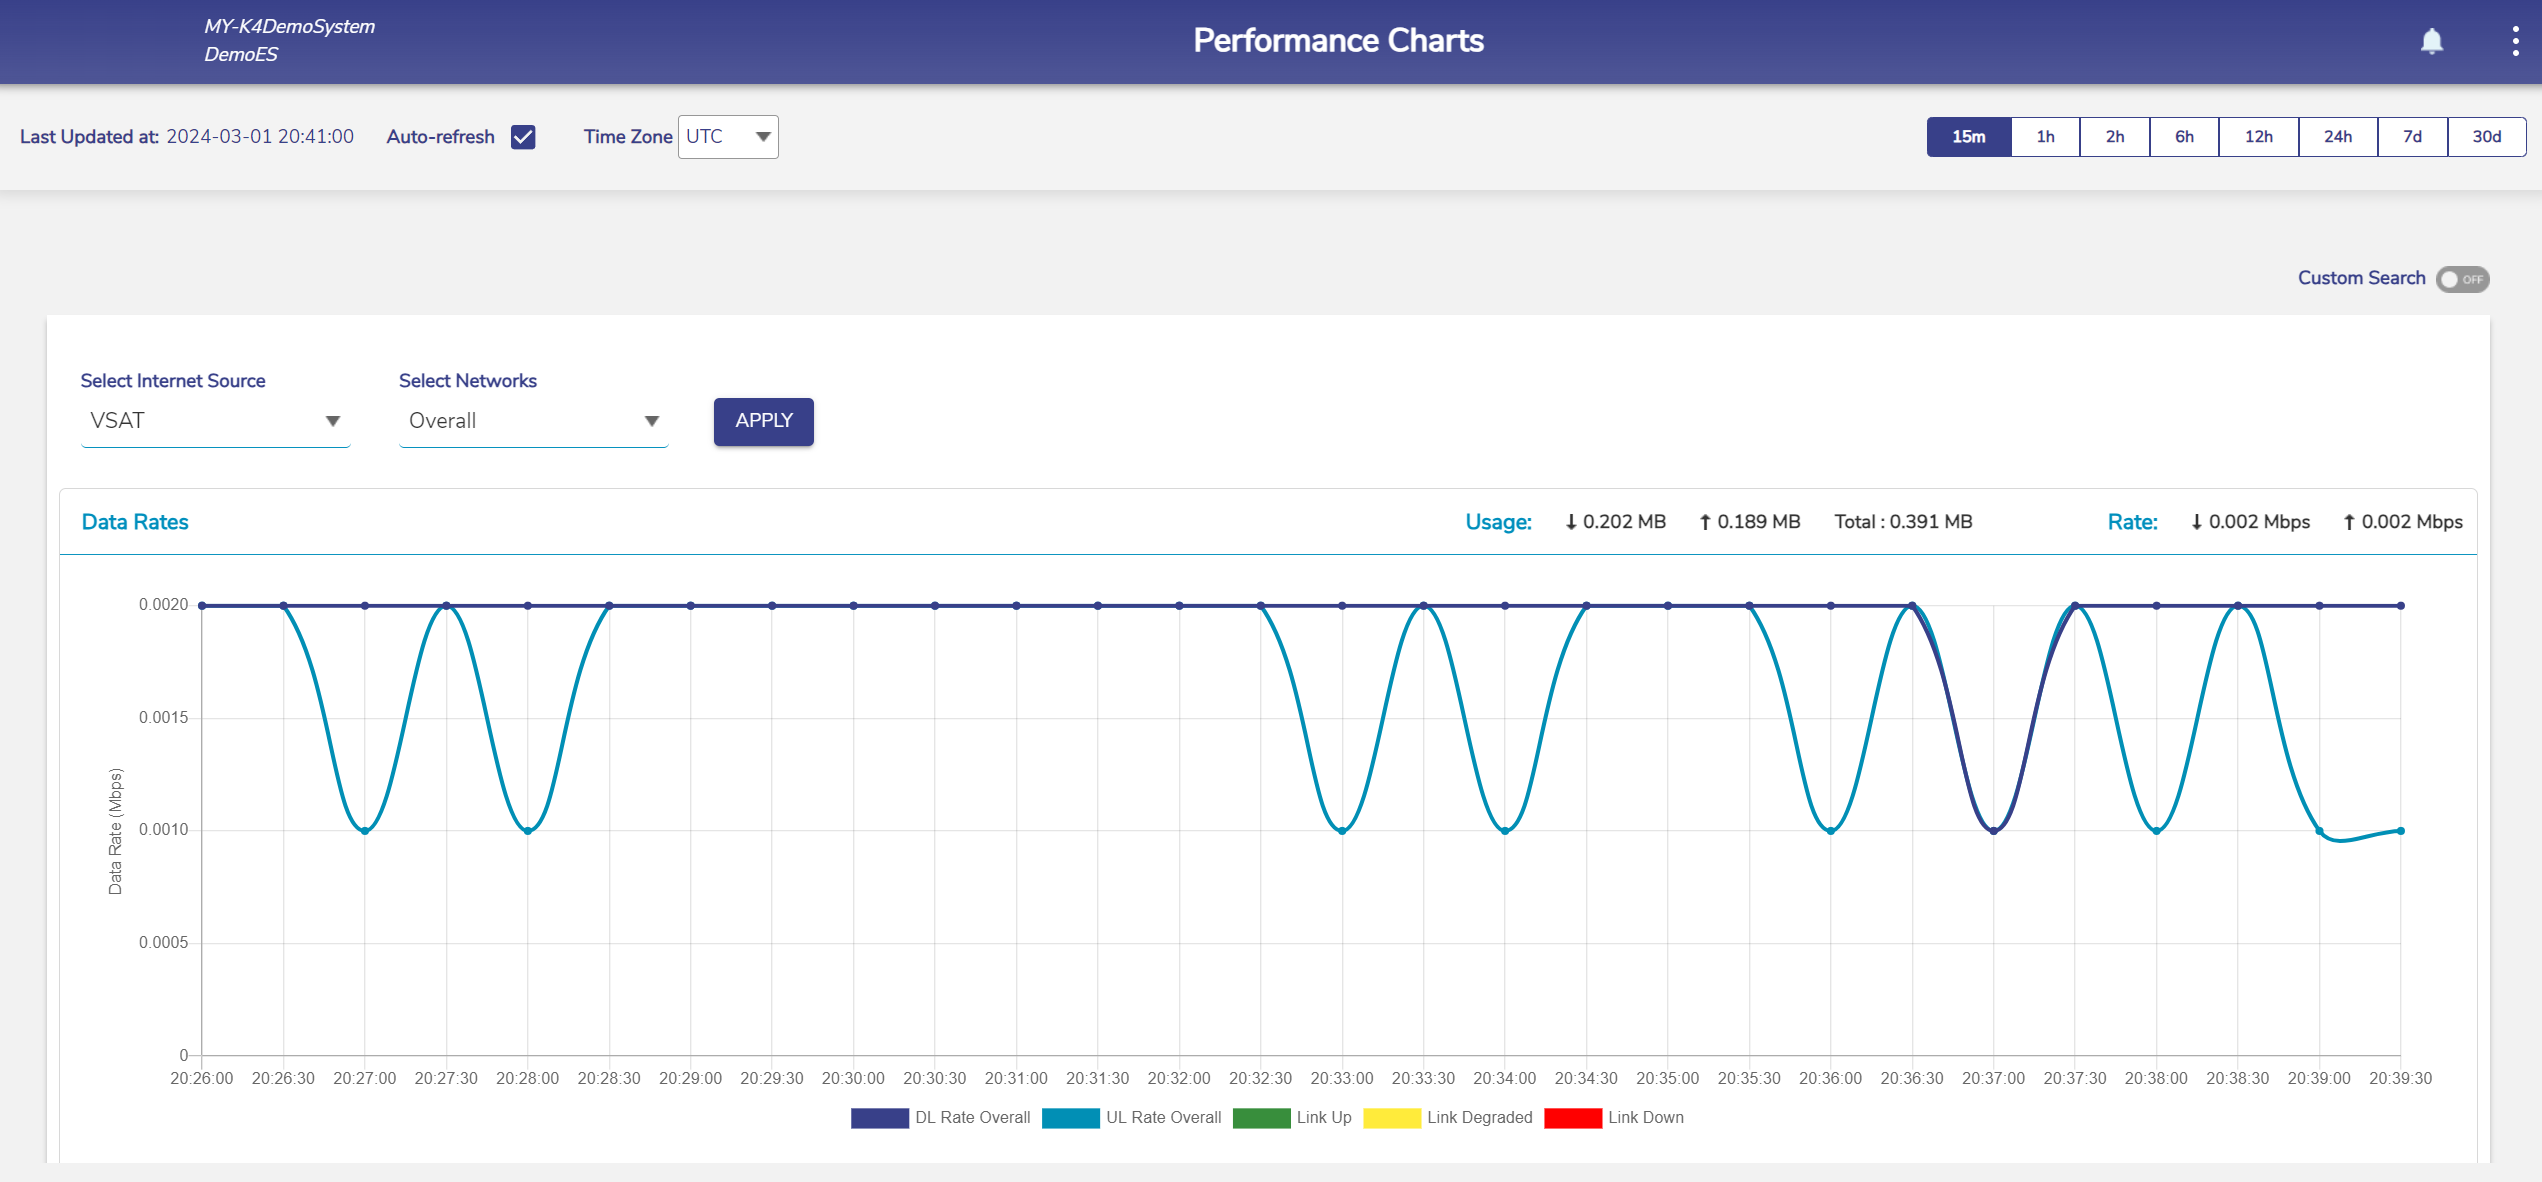
Data Rates
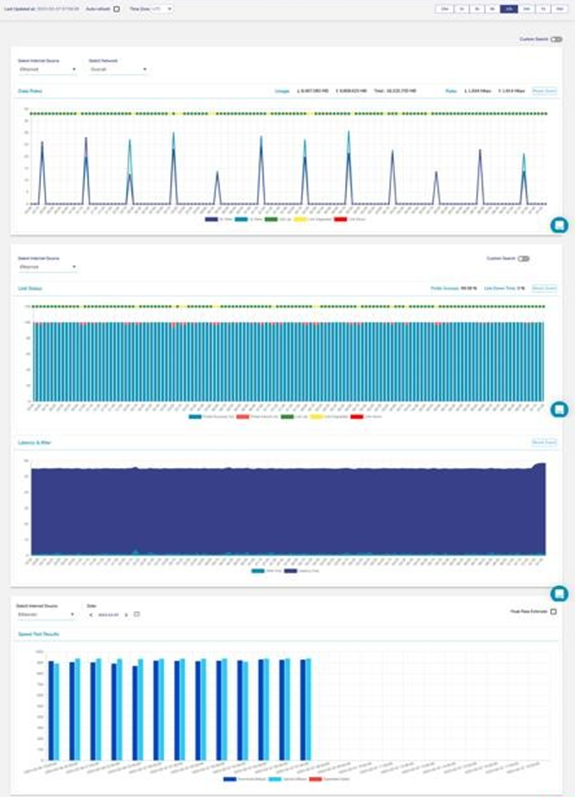
Native Link Status, with Probe Success and Down Time
PEP (Performance Enhancing Proxy) Link Status
Latency & Jitter
Speed Test Results, with Peak Rate Estimate
Performance Charts
Viewing Performance Charts
To view the performance charts, perform the following steps.
Steps
· Log on to the EdgeOS System. The home page appears.
· Click the menu icon. The menu appears.
· Click Performance Charts. The Performance Charts page appears. See figure below.
Performance Chart
For description of the information displayed on the Performance Charts, see Table below.
Fields | Description | Configuration |
Data Rates | DL/UL rates chart of the internet source for a specific network is generated. | To view the DL/UL rate chart for a network, perform the following steps. Steps
· In the Internet Source list, click a WAN link or an internet source. · In the Network list, click single or multiple networks. · Click Apply. The performance chart is generated.
To view the network level usages for VSAT and Cell, user must click either VSAT or Cell. If the network selected in the Network list does not apply to the internet source selected in the Internet Source list, then the alert is displayed. |
Link Status | The status chart of the probe and link is available. | To view the link status chart for a network, in the Internet Source list, click a WAN link or an internet source. The performance chart is generated. Or, To view the link status chart for a network based on day and time, perform the following steps. Steps · Switch on the Custom Search icon. The Start Time, End Time, and Interval (sec) fields become available, see Figure Custom Search. · Click Start Time. The calendar becomes available. · Select the start day and time. The start day and time become available in the time zone selected on the portal. · Click End Time. The calendar becomes available. · Select the end day and time. The start day and time become available in the time zone selected on the portal. · In the Interval (sec) field, click the minimum interval specified. · Click Apply. The chart is generated. Additionally, Probe Success % and Link Down Time % is also available. |
Latency & Jitter | Latency & Jitter chart is available. | N/A |
Speed Test Results | Periodic speed test results for an interface are available. The periodicity is as per the configuration set for that interface. | To view the Speed Test Results chart, perform the following steps. Steps · In the Internet Source list, click a WAN link or an internet source. · Click the calendar in the Date field and select the date of when the speed test result chart is to be generated. The chart is generated. To view Peak Rate estimate results for the interface, perform the following steps. Steps
|
Table Performance Chart Information
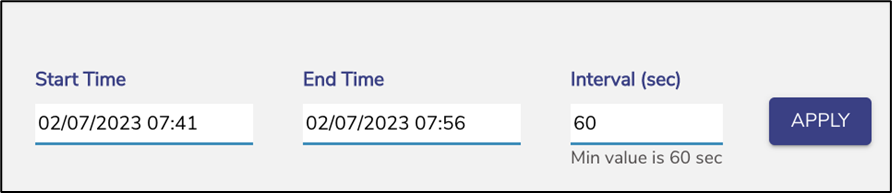
Custom Search
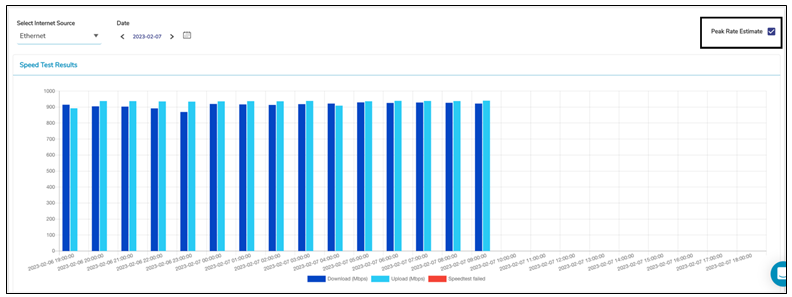
Peak Rate Estimate