Hub Service Status
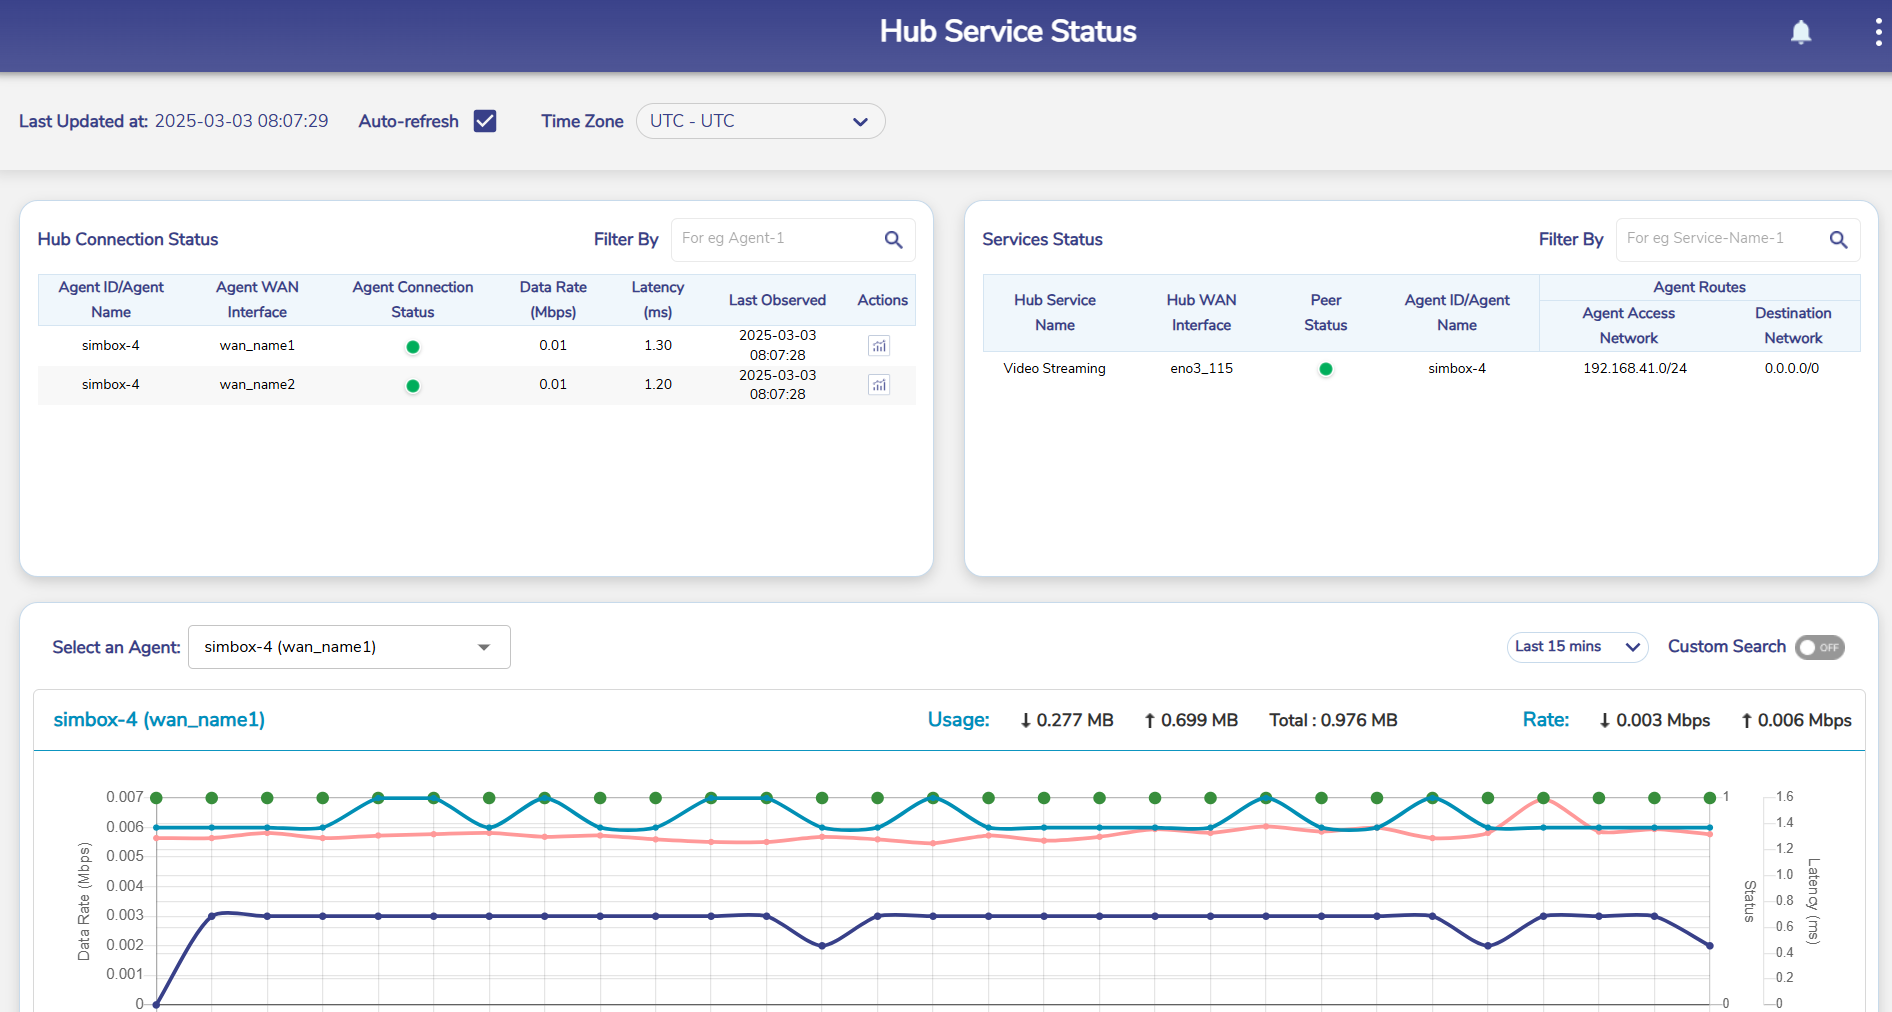
The Hub Service Status screen serves as the landing page when hub is enabled. This screen provides a snapshot of the status of the Interfaces, Agents, Services and Network Usage across WAN Interfaces. It provides a comprehensive time chart functionality to plot Data Rate, Status and Latency metrics over selectable time periods for any given Agent. Once the Hub System is configured, user can monitor the performance of the Agents.
Viewing Hub Service Status
To view the Hub Service Status, perform the following steps.
Steps
The Hub Service Status serves as the homepage where users are directed upon logging in.
The user can also reach the Hub Service Status page by clicking the Menu
 icon at the top right corner and selecting Hub Service Status.

Hub Service Status
Fields | Description | Configuration |
Last Updated At | This shows the last timestamp at which this screen was updated. | N/A |
Auto-refresh | Allows data on this page is to be refreshed automatically. Data is updated at an interval of 30 seconds. | To automatically refresh the details of the Agent, select the Auto-refresh check box. |
Time Zone | Allows selection of time zone to access the details on this screen based in that time zone. | By default, the UTC time zone is configured. Select the required Time zone in the Time Zone field. |
Hub Connection Status
The user can view the Hub Connection Status panel as shown below:

Hub Connection Status
For details on Hub Connection Status, refer the table below.
Fields | Description | Configuration |
Agent ID/Agent Name | Identification number or name of the agent connected to the Hub. | |
Agent WAN Interface | Shows the name of the WAN Interface connected to the agent. | |
Agent Connection Status | Shows the status of the Interface. Following options are possible.
| N/A |
Data Rate (Mbps) | Shows the data speed on the interface. | |
Latency (ms) | Shows the latency experienced by the interface. | |
Last Observed | Shows the last timestamp at which the device was online. | |
Actions | Redirects the user to the Data Range, Status and Latency chart. | Click the |
Filter By | The Filter By field can be used to filter the table based on the Agent name and the Wan Interface name. |
Service Status
The user can view the Service Status panel as shown below:

Service Status
For details on Hub Connection Status, refer the table below. The data is shown according to the services added in the Hub Settings screen.
Fields | Description | Configuration |
Hub Service Name | Shows the name of the Hub Service. | |
Hub WAN Interface | Shows the name of the Hub WAN Interface. | |
Peer Status | Shows the status of the Connection. Following options are possible. Up Down | |
Agent ID/Agent Name | Identification number of the agent or agent name connected to the Hub. | |
Agent Access Network | IP Address of the Agent Access Network used. | |
Destination Network | IP Address of the Destination Network used. | |
Filter By | The Filter By field can be used to filter the table based on the Service name and the Wan Interface name. |
Data Rate, Status and Latency Chart
Scroll down in the Hub Service Status page to view the Data Rate, Status and Latency chart of all the Agents connected to the Hub.
Select any Agent in the Select an Agent field dropdown window.
Select the Periodicity from the dropdown menu at the top right corner of the panel.
The user can also select a custom date and time interval using the Custom Search toggle button.
Click the Custom Search toggle button. The Start Time, End Time, and Interval (sec) fields become available.
Select the Start Time and End Time.
In the Interval (sec) field, click the minimum interval specified.
Click Apply button.
The chart is generated as per the selected time period.

Chart
The Key Metrics shown in the chart are:
Data Rate (Mbps)
Status
Latency (ms)
The performance of the selected Agent based on the above metrics is shown in the form of a line chart. The horizontal axis contains the time instances, and the vertical axis contains the key metrics in their corresponding SI unit.
The graph between these two axes gives the user a clear understanding of how the Agent has performed during the selected time interval.
The Legend provided below the Chart helps the user to differentiate between the various lines in the chart.
The status of the Agent at each time instance on the X axis is also denoted by green dots and red dots on the chart.
 - Status Up
 - Status Down
